
Real wear, from a real baseline.
TundRA Mapreportstheresidualthicknessofeverytundishliningagainstitsownmeasuredbaselines,cellbycellfromthedayitisrelined.Neverwearagainstanominaldrawing.
Every surface at a favourable angle, post-deskull, no vessel entry. Positions depend on the tundish configuration; one or two is most common.
Wear map, zone report and draft narrative, ready for engineer approval.
Rim targets and a shell-fixed frame, corrected for shell expansion at the recorded temperature.
Each cell averages many points, so its value is far more precise than any single point.
Compared with the bare shell, the as-built lining and the previous scan.
Figures are TundRA Map design targets.
Six steps. Three gates. One record.
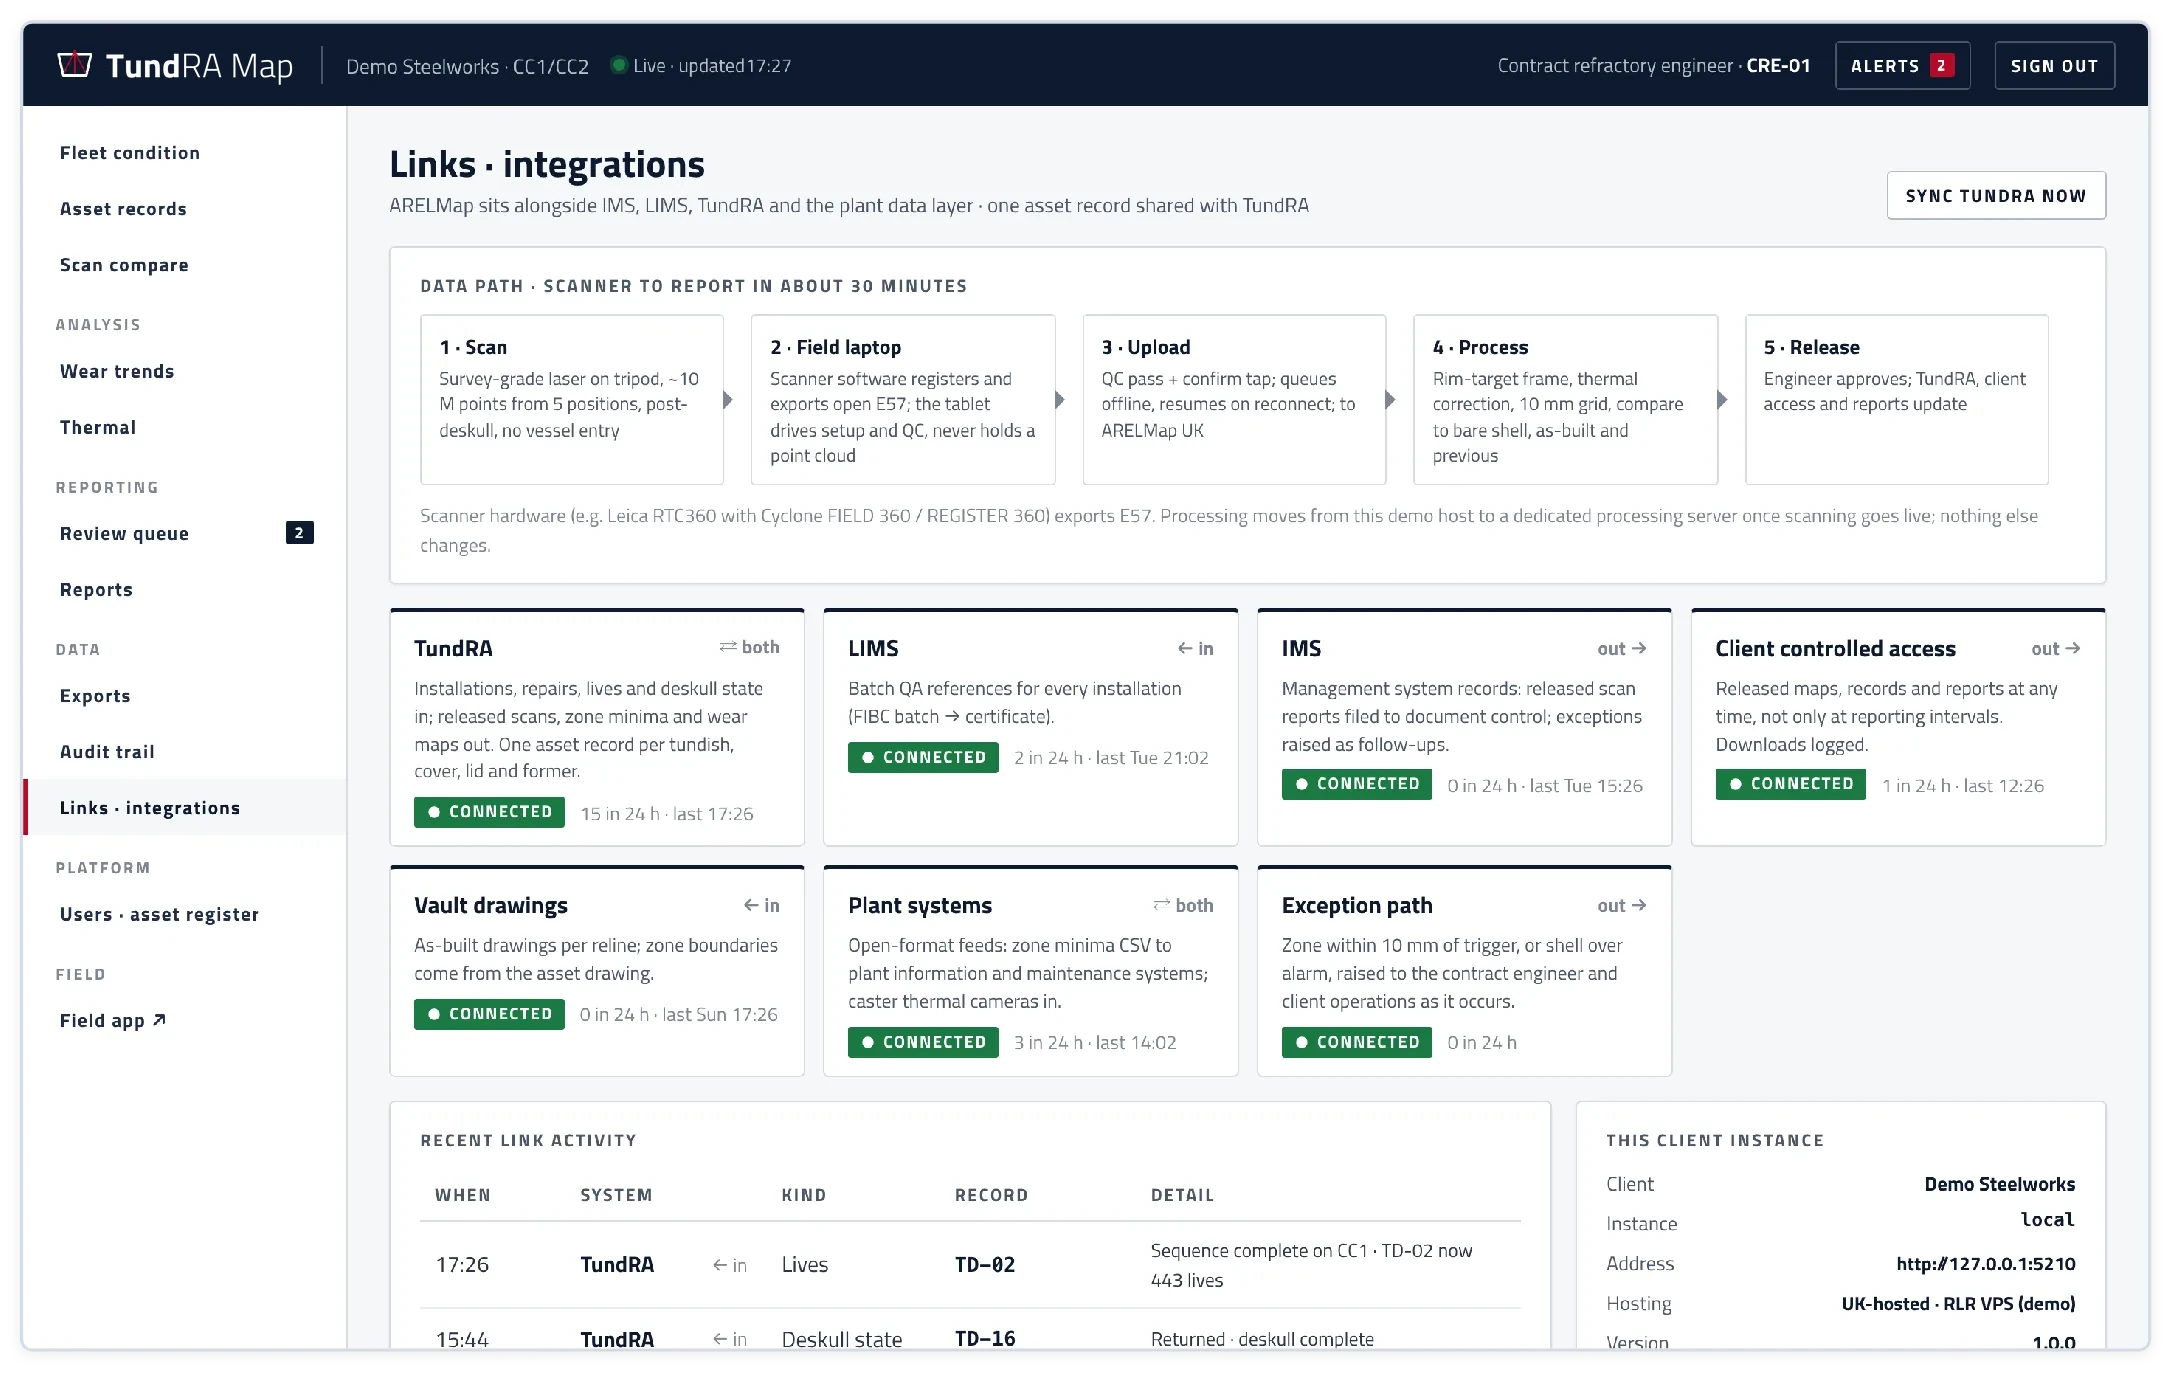
Capture happens on site. Processing and storage happen in the UK-hosted cloud. Nothing is released until your engineer has approved it.
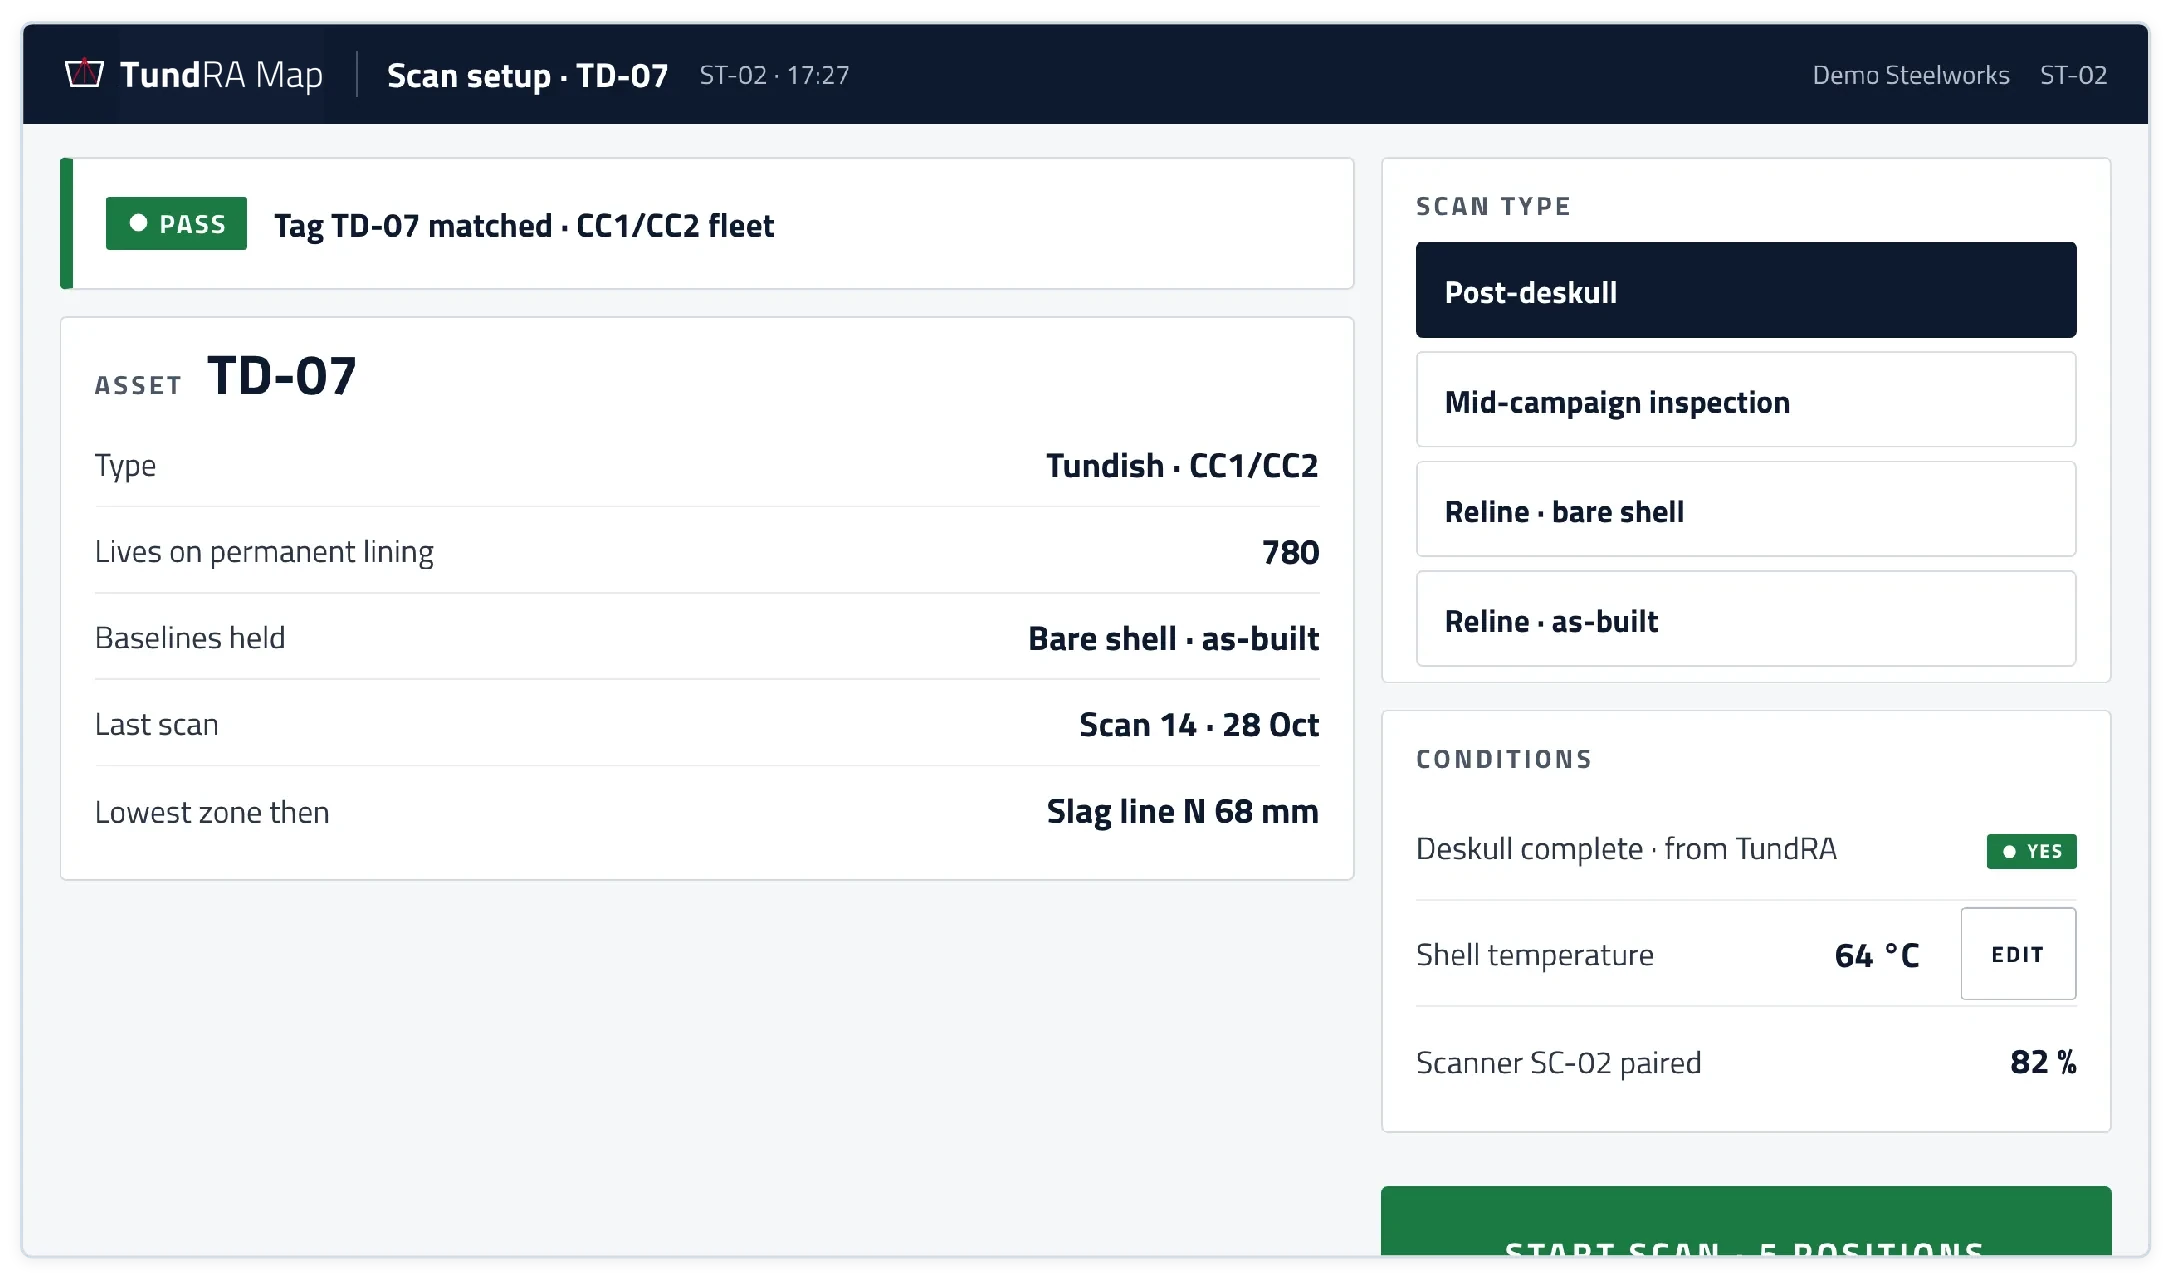
Scan setup
The tablet reads the tag on the tundish shell. Deskull state comes from TundRA; the technician records the shell temperature.
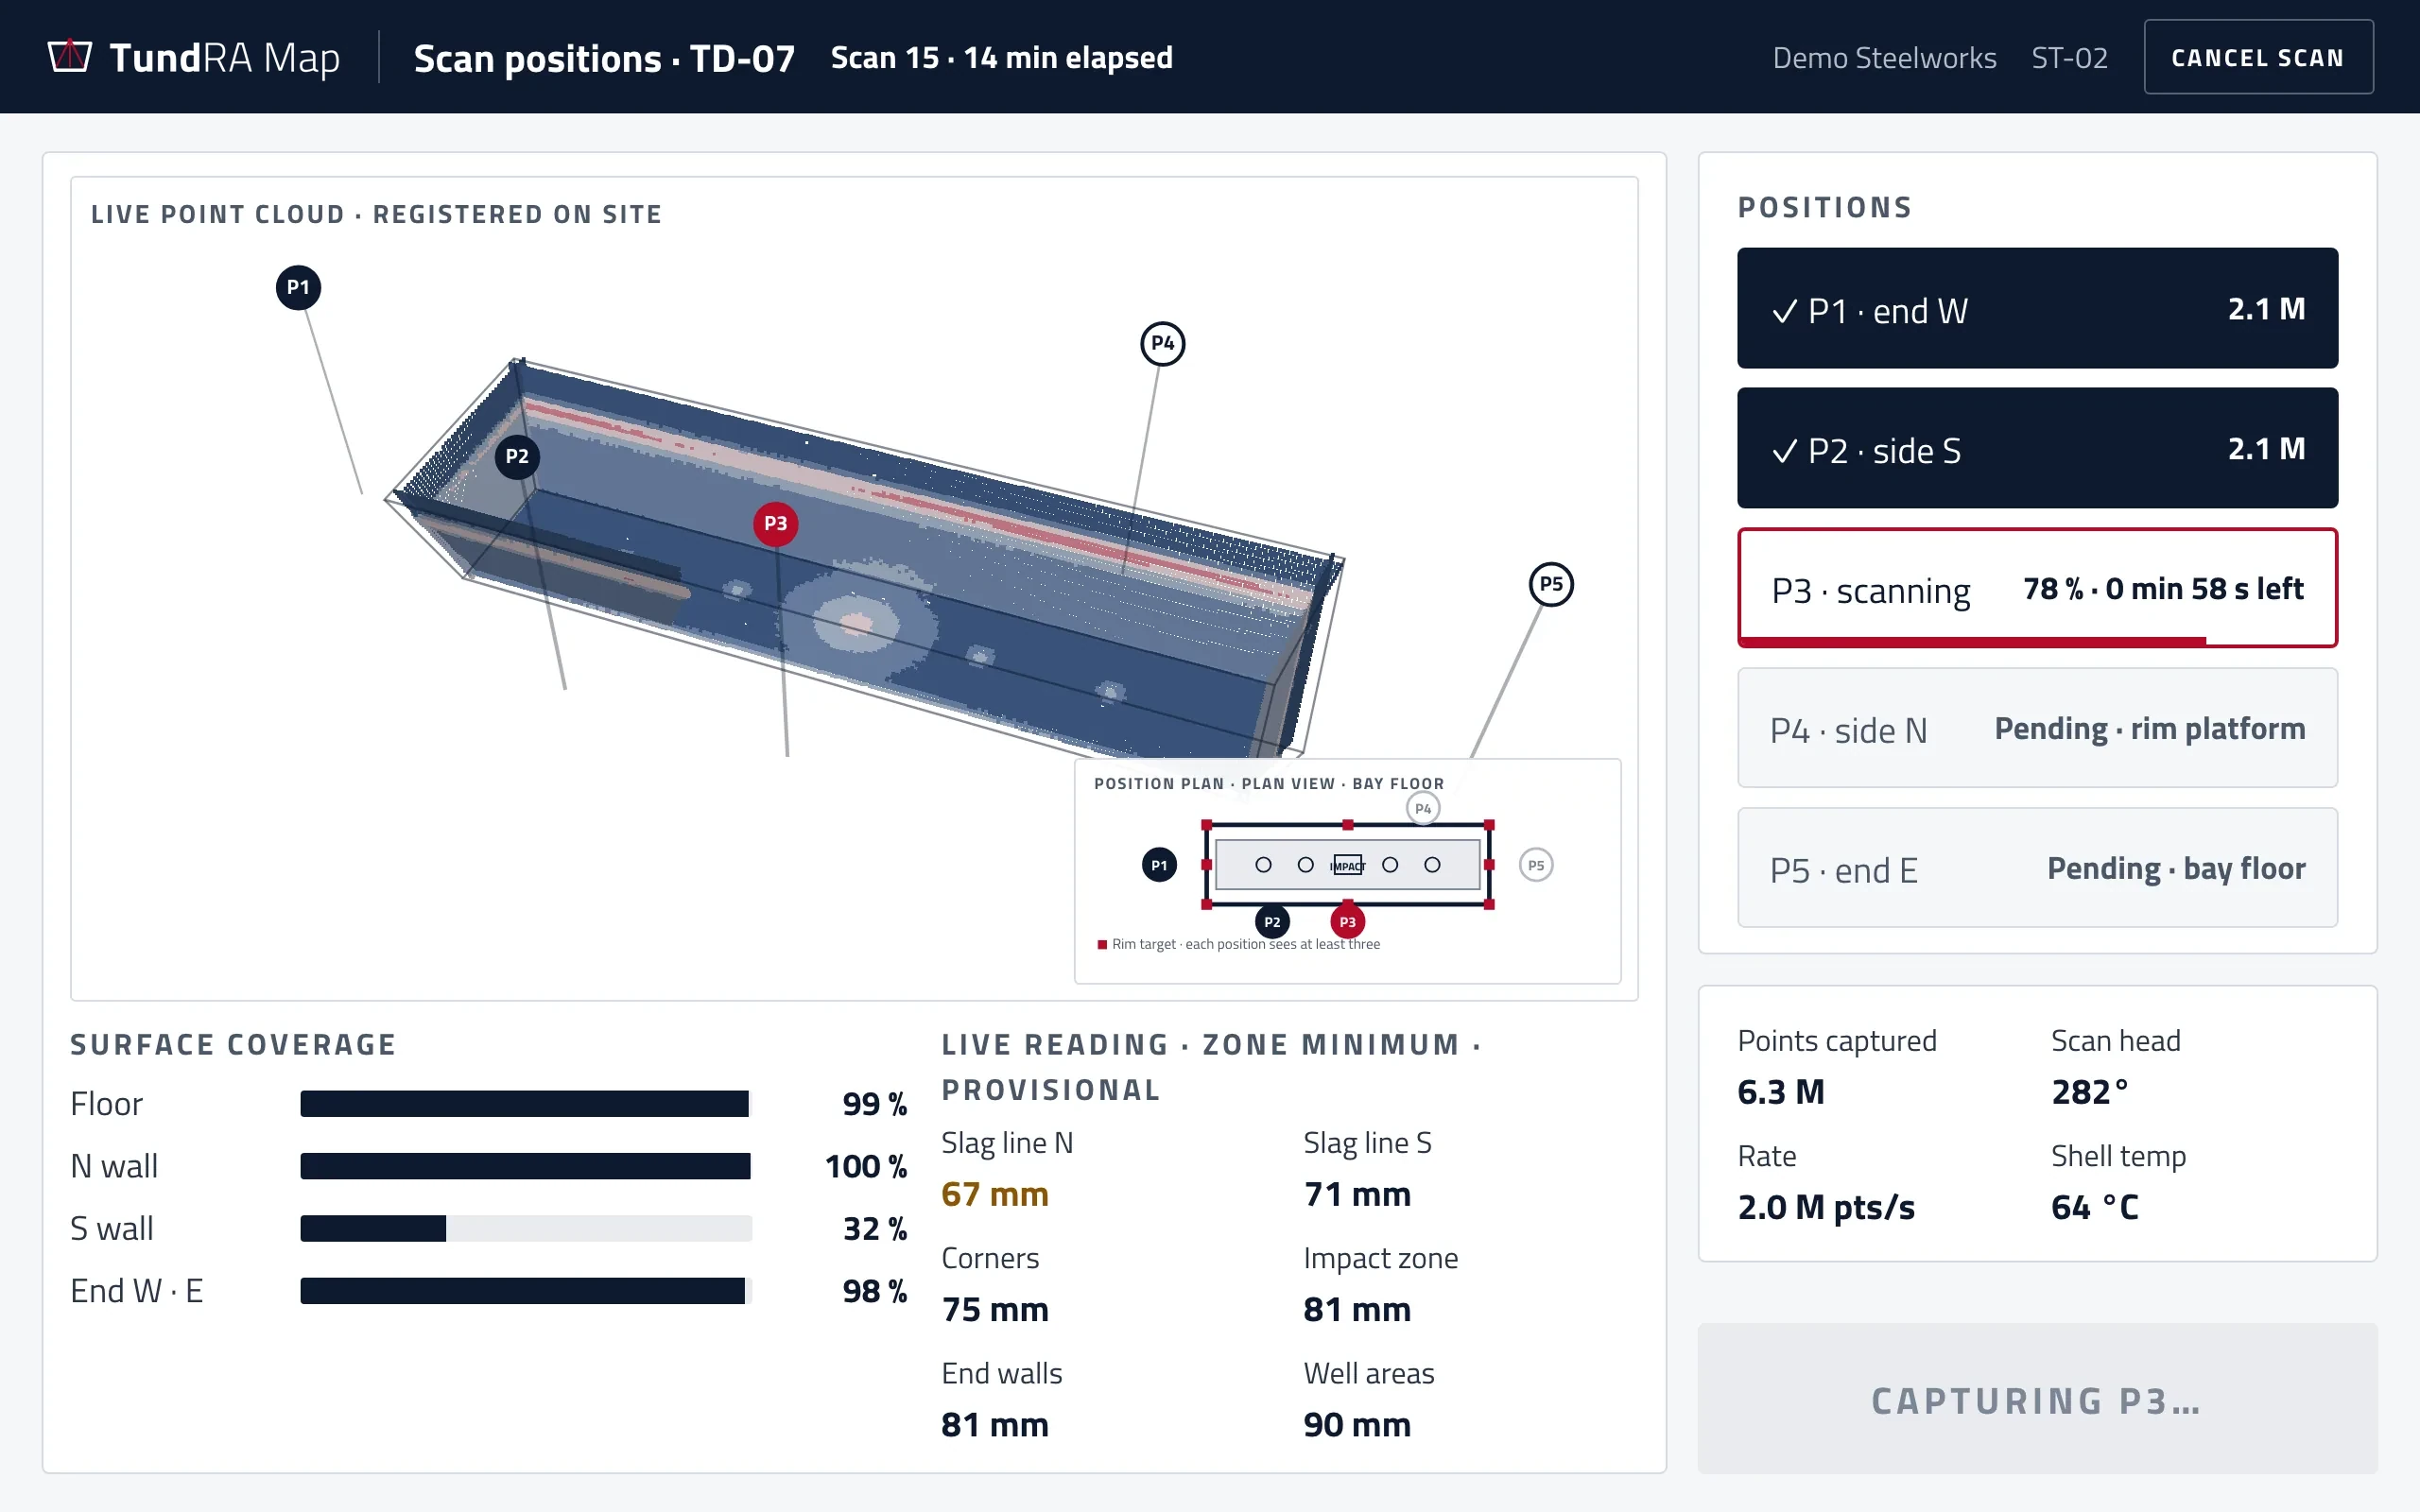
Scan positions
One scanner, set up on the bay floor or rim platform, with no vessel entry. Most tundishes need one or two positions.
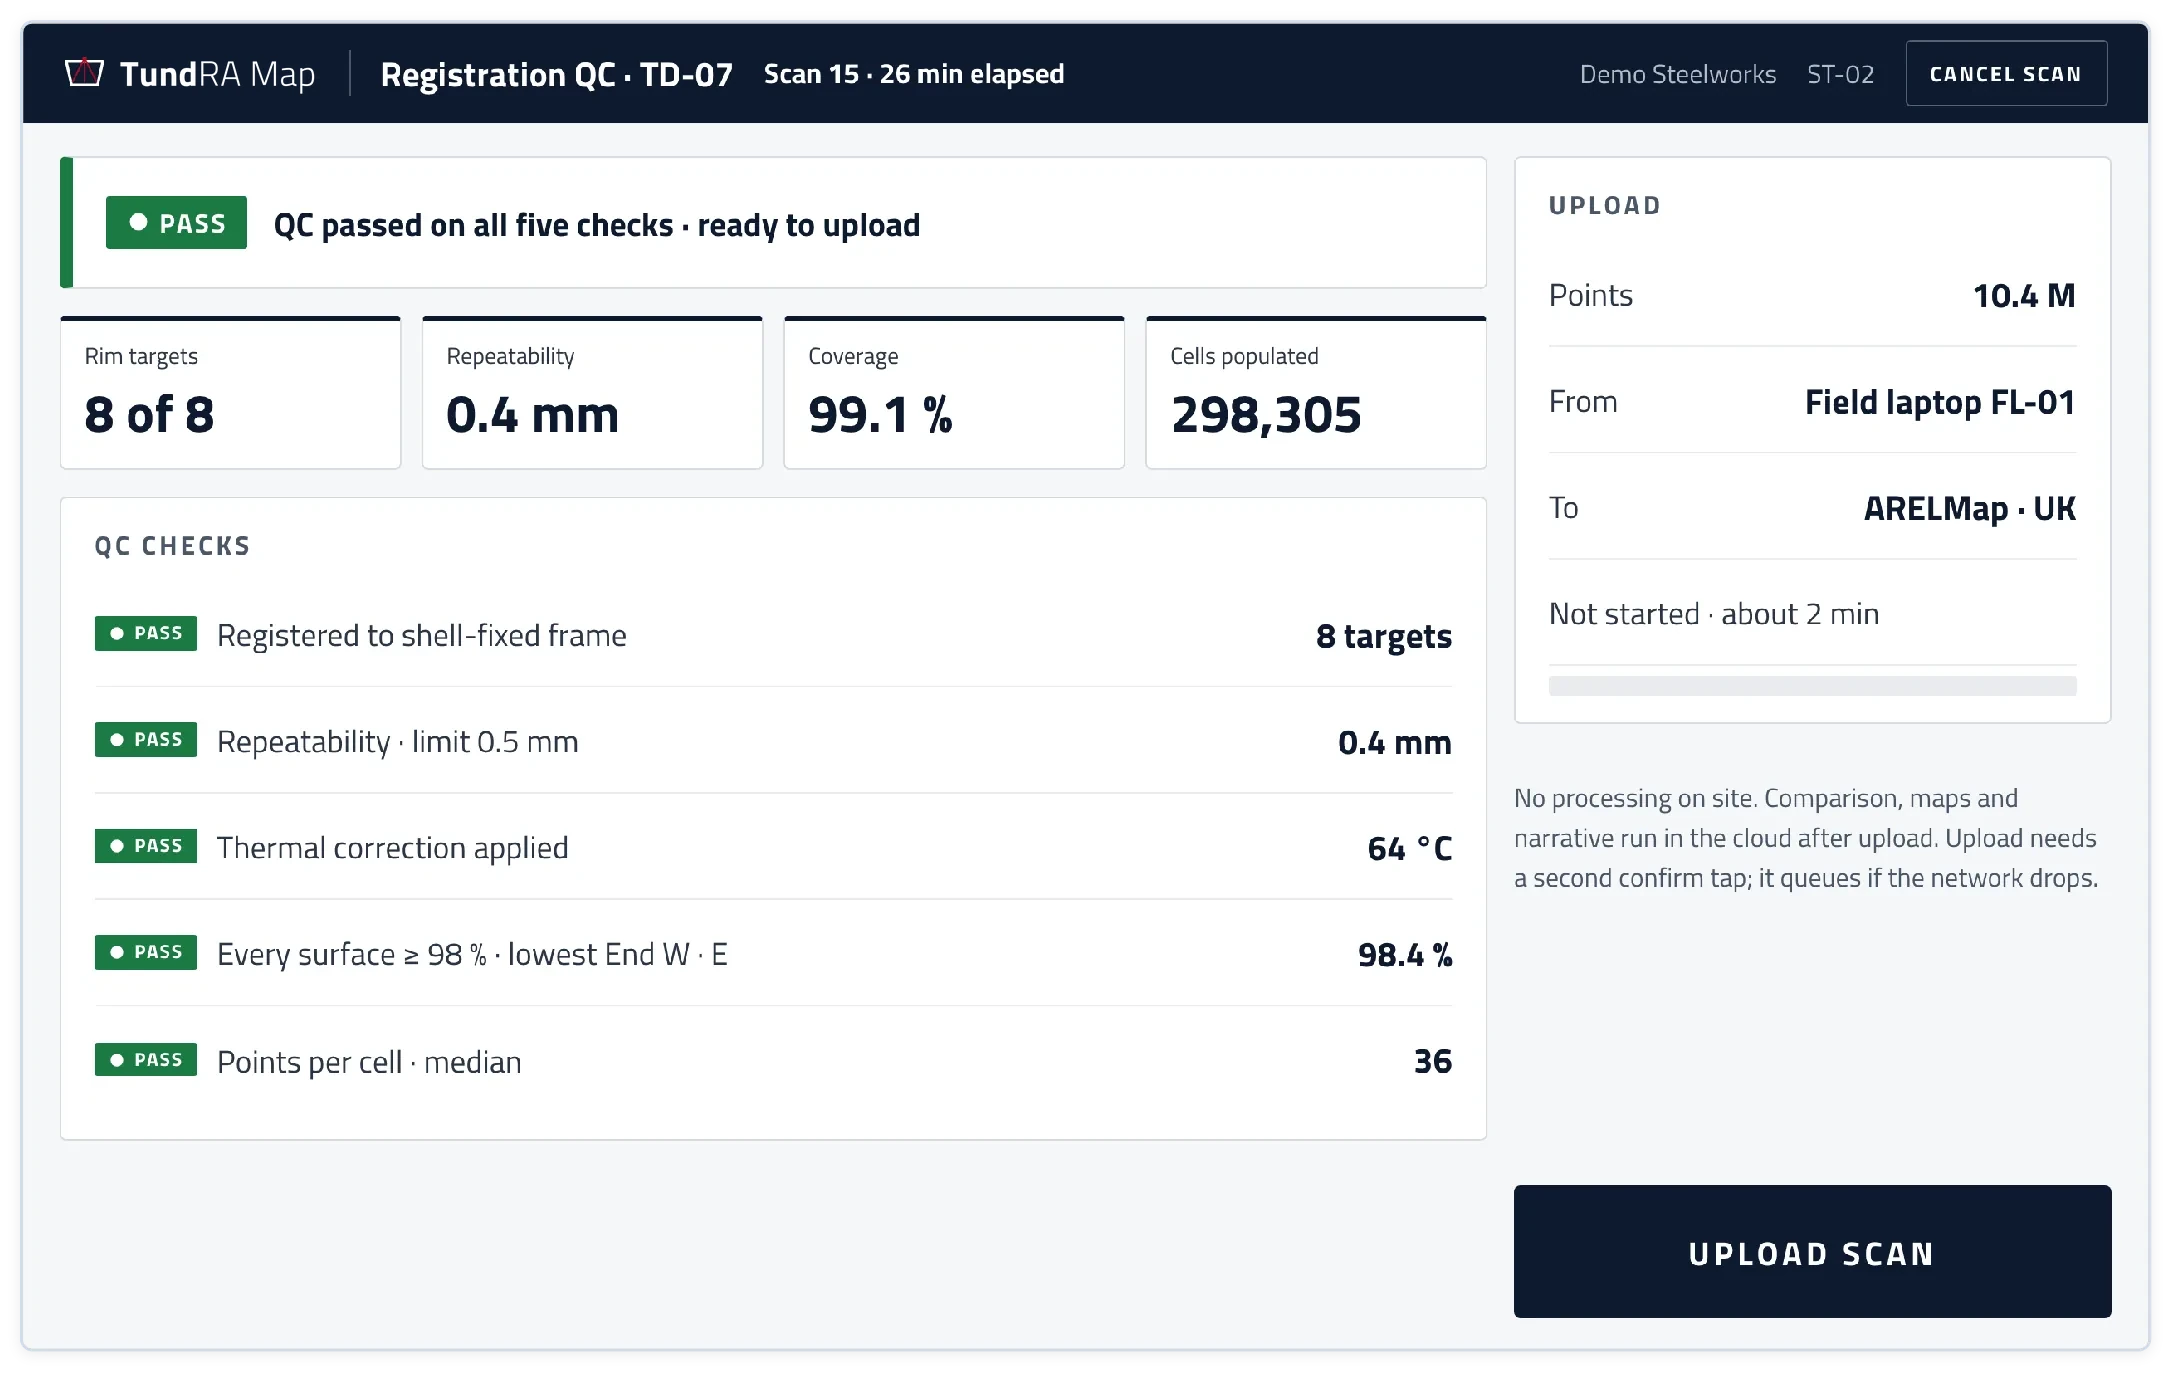
Registration QC
Checked in the bay, so a bad scan is never uploaded. A failed check reopens only the position that caused it.
Cloud processing
Gridded into 10 mm cells and compared with the bare shell, the as-built lining and the previous scan.
Engineer review
The platform drafts the interpretation. Your refractory engineer writes the assessment and approves.
Released
To TundRA, to the client's controlled access and into the shift report.
Built for the tundish bay.
The TundRA Map field app runs on a rugged tablet and takes the technician through one asset, one scan, one step at a time.
Tag first
The camera reads the shell tag, so a scan can only be opened against the right vessel.
No vessel entry
Every scanner position is on the bay floor or the rim platform.
Live coverage
The lining builds up on screen as the laser sweeps, so a missed wall is seen before the scanner moves on.
Quality decided on site
Rim targets, repeatability and coverage are checked before upload; only a failed position is repeated.
Made for gloves and dust
Large tap targets, a high-contrast light screen, no swiping, and an upload that queues if the network drops.
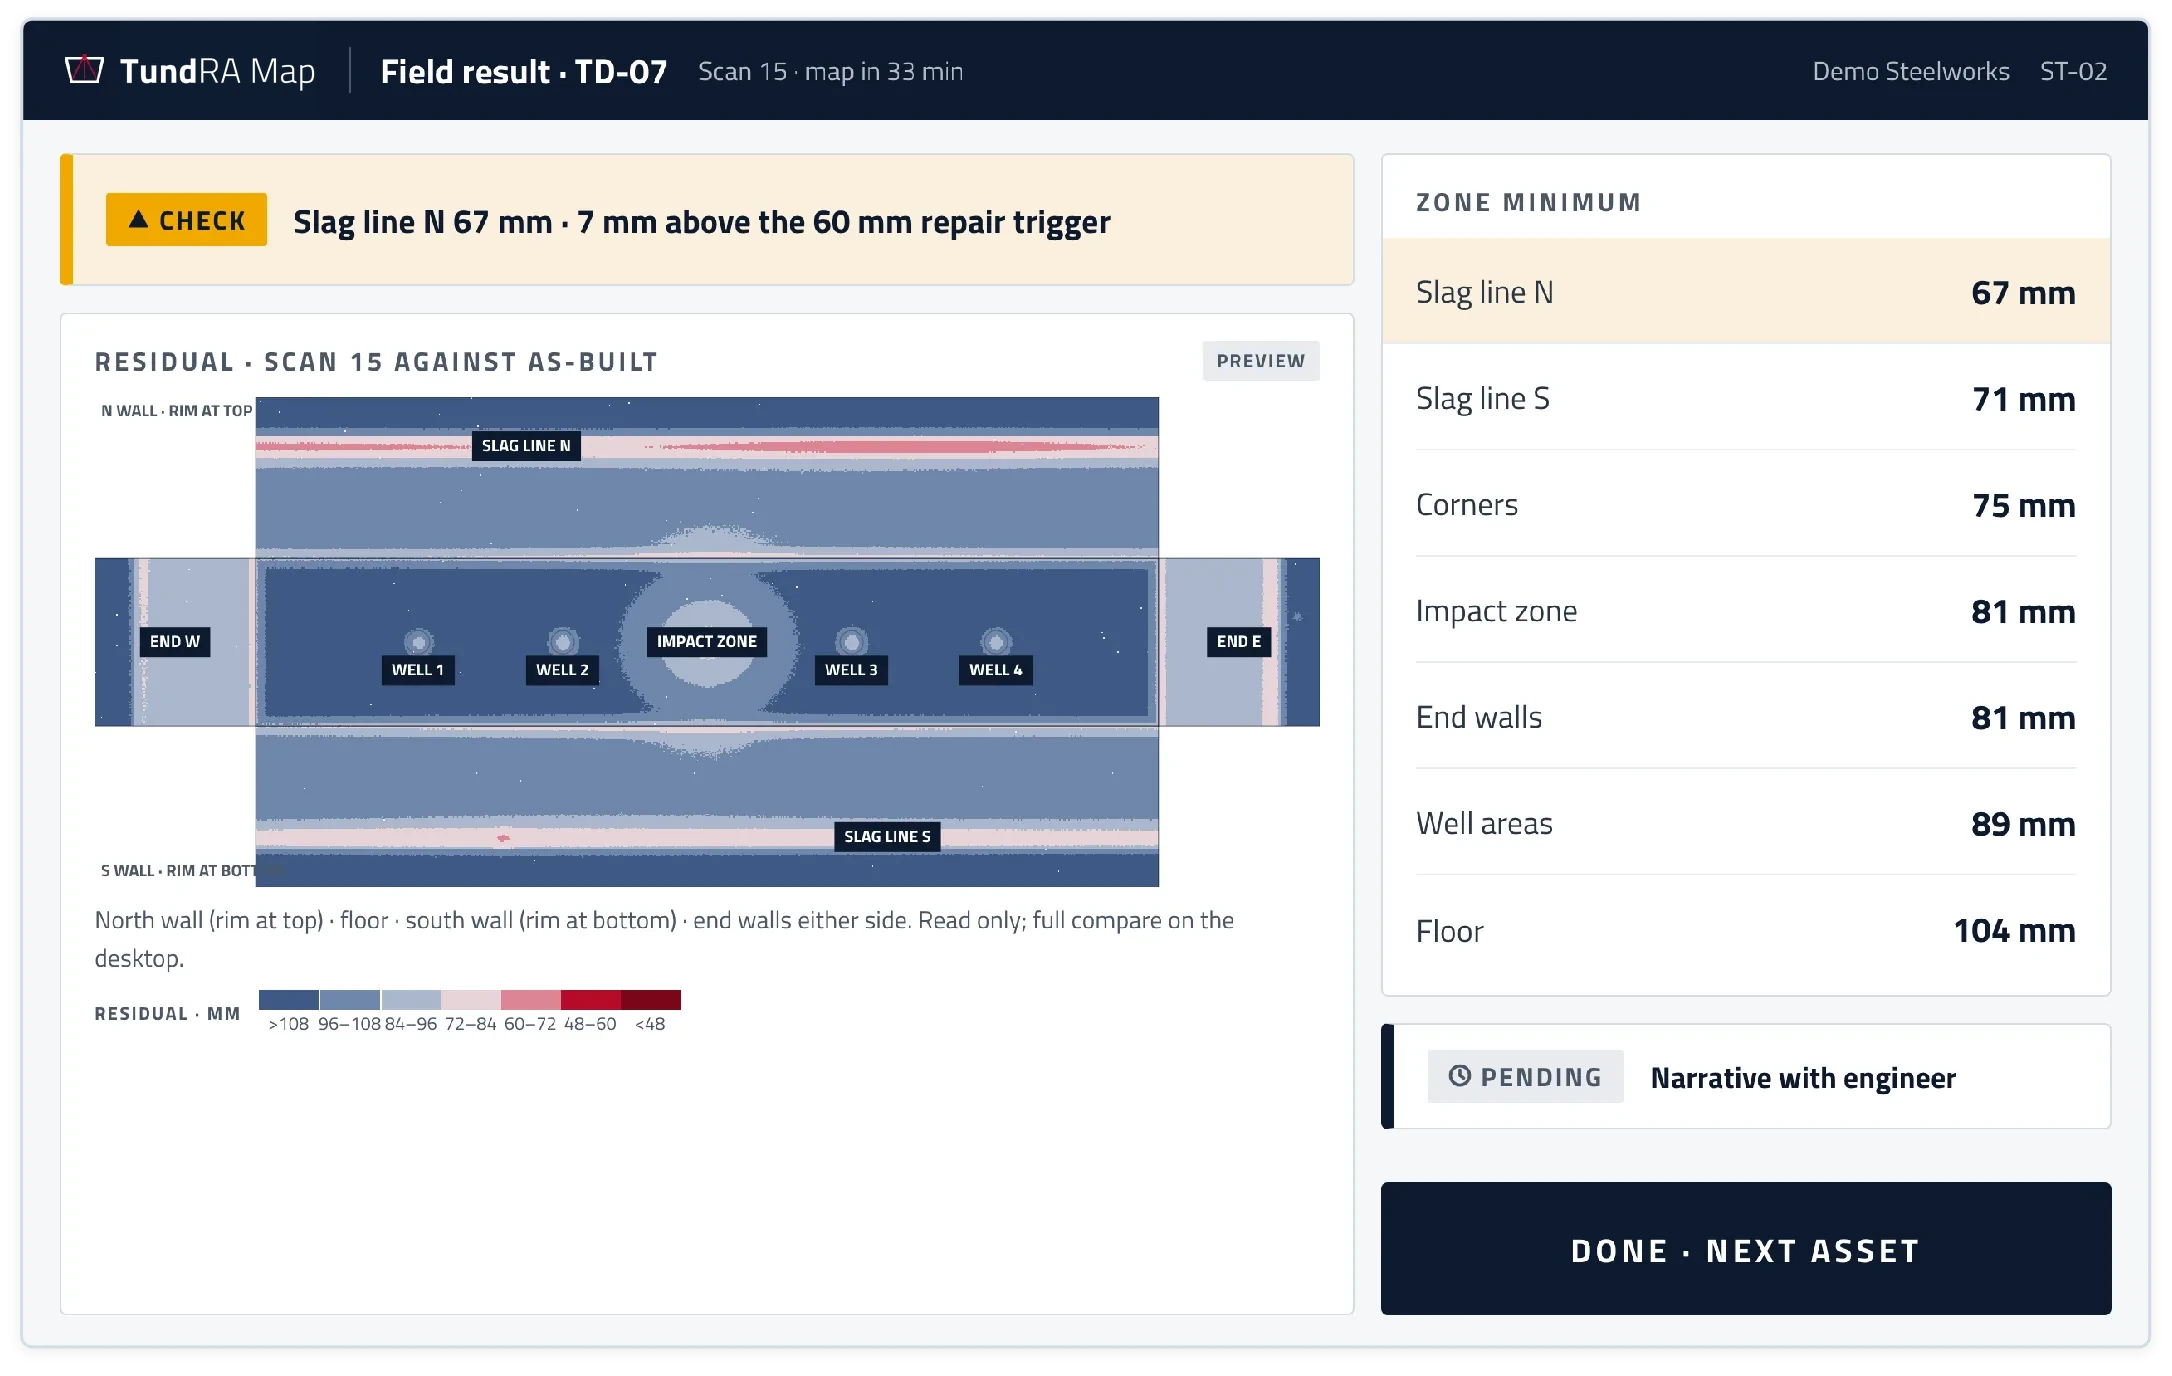
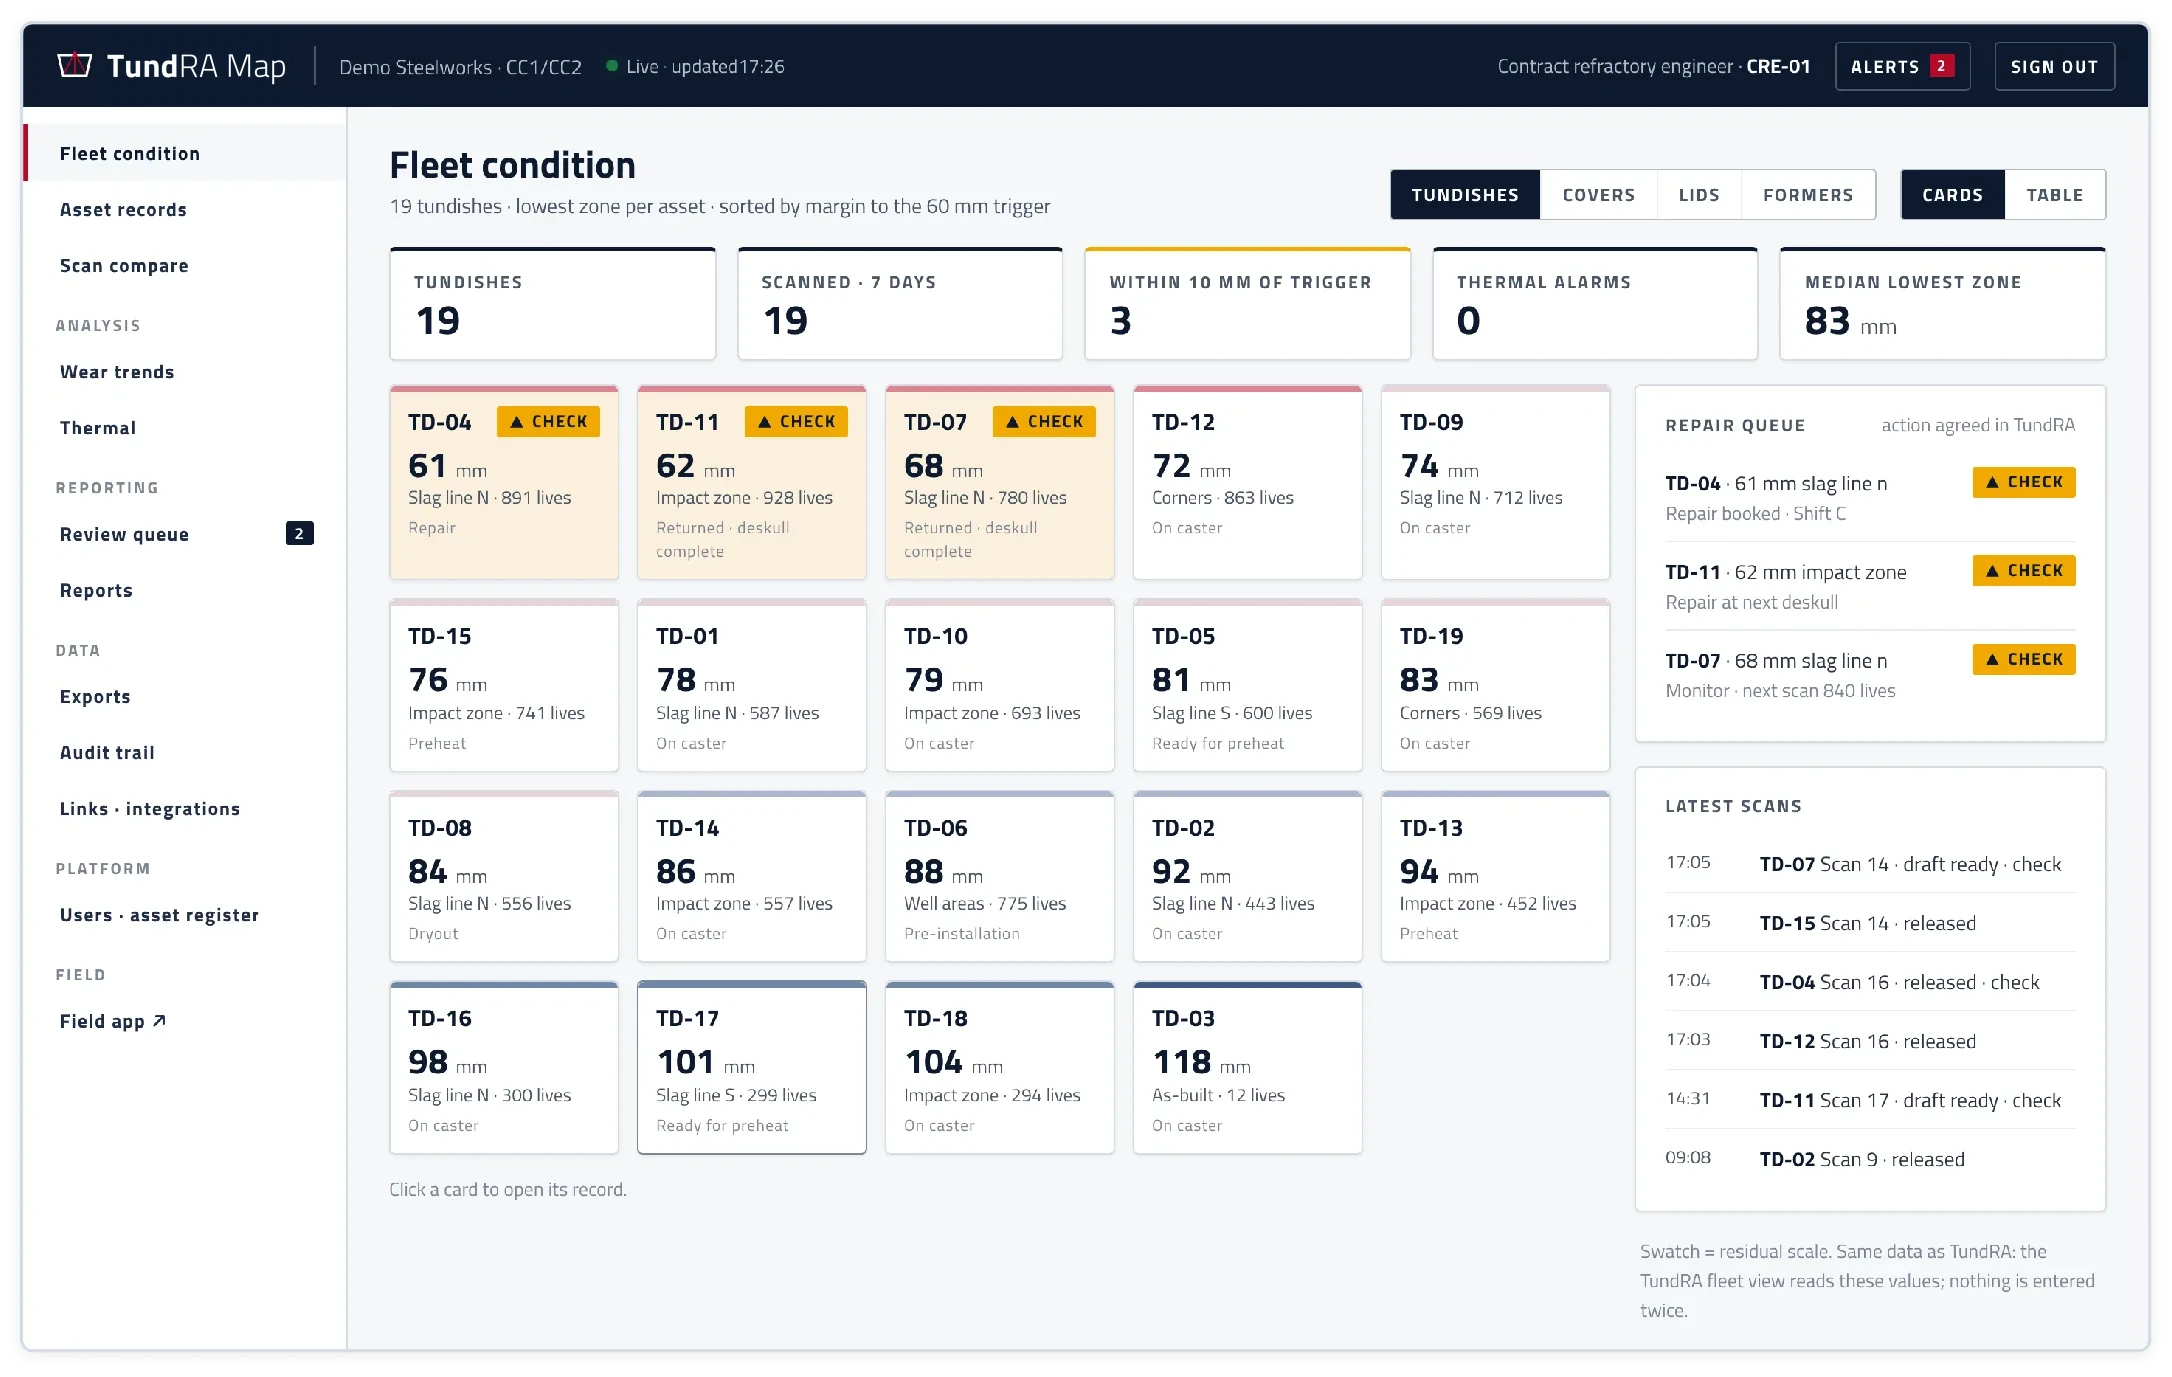
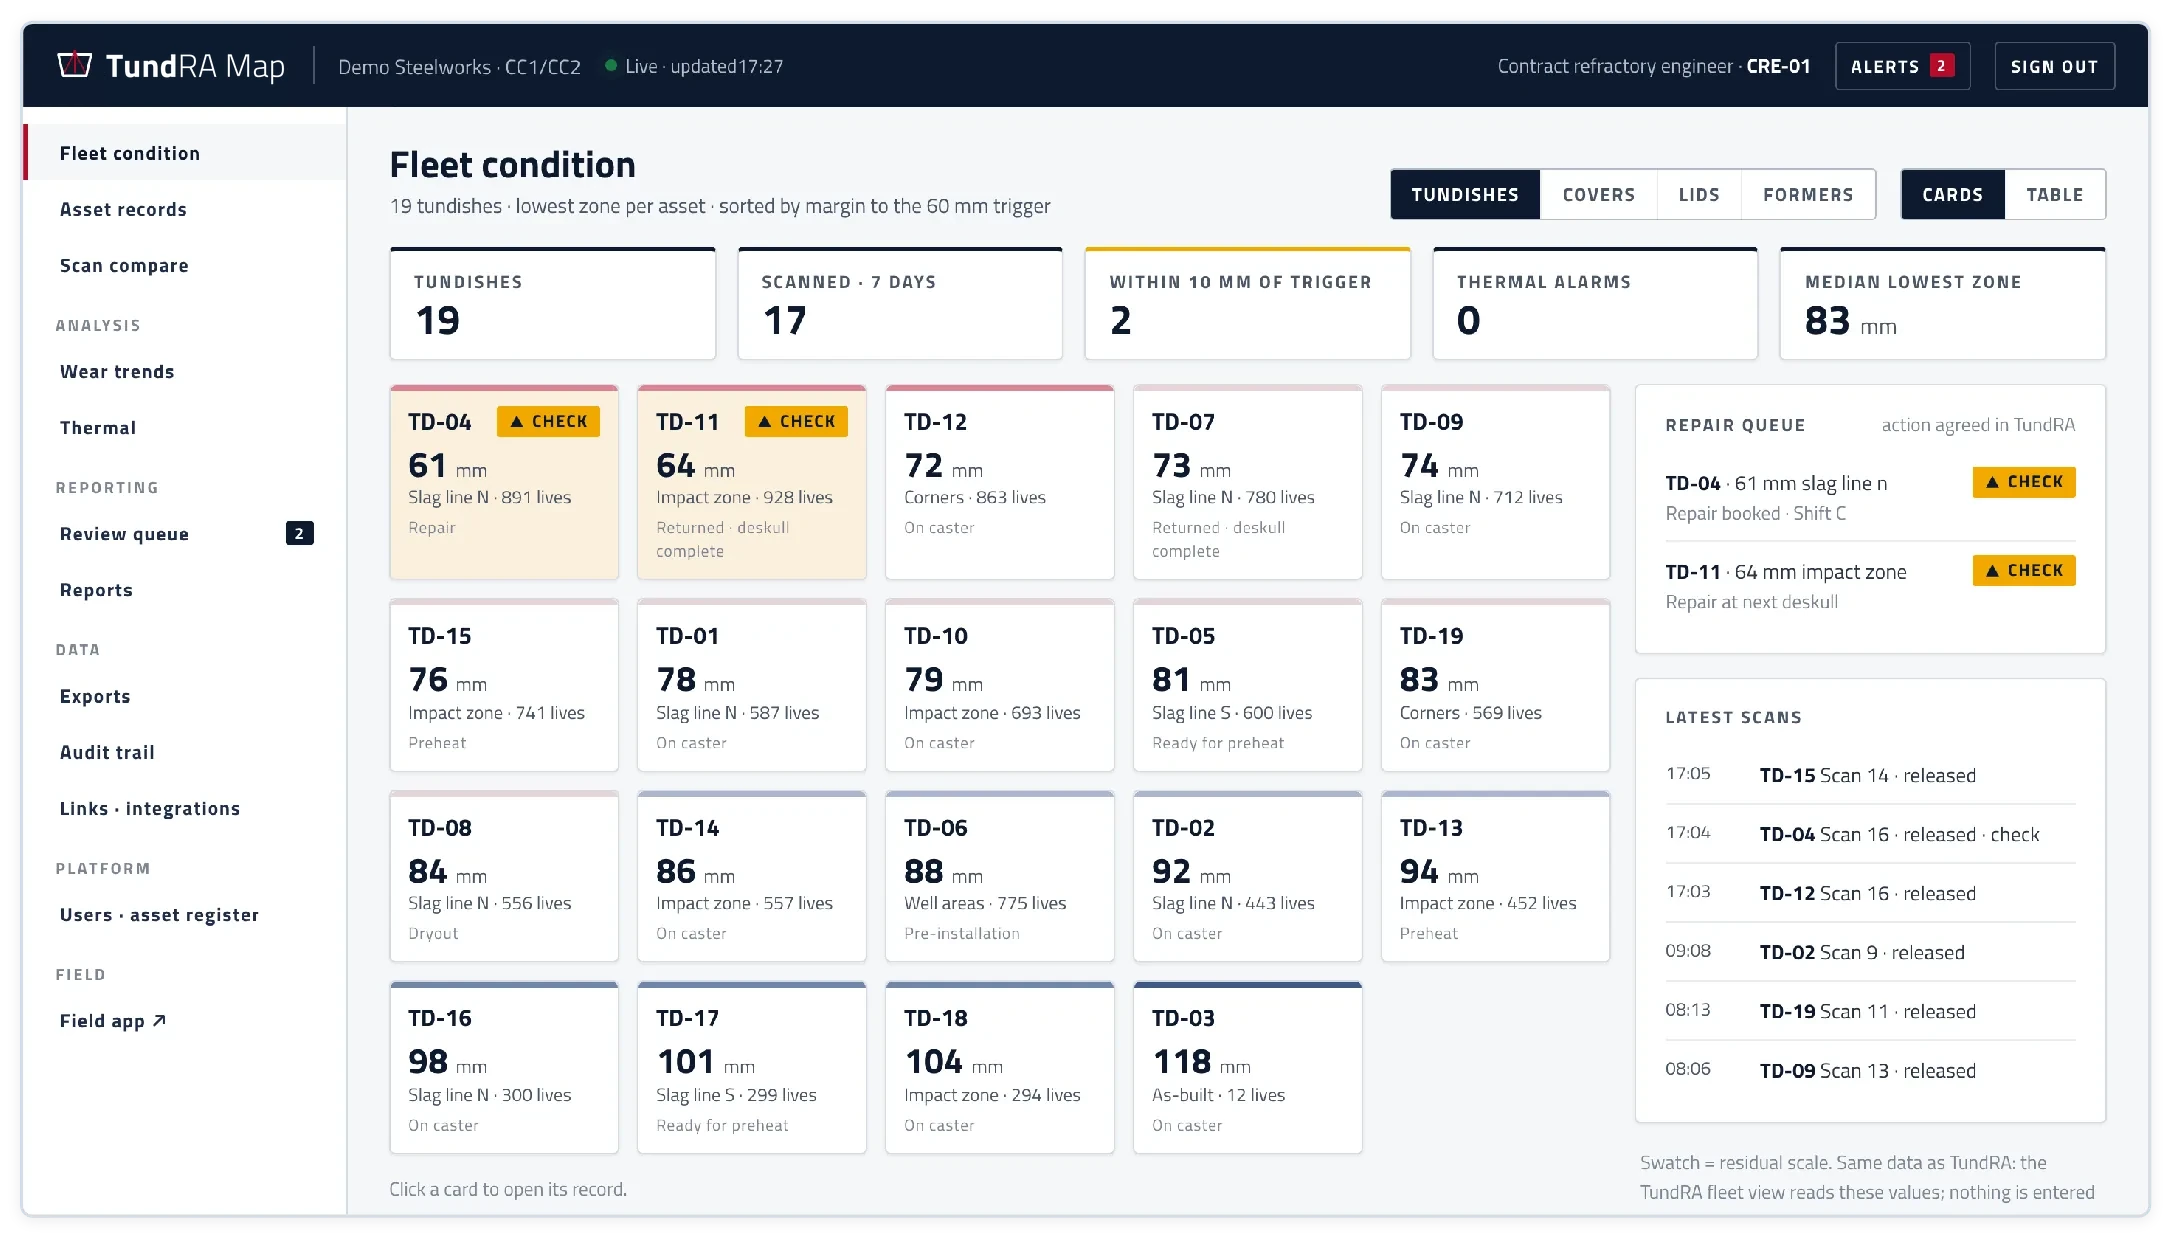
The TundRA Map desktop answers the first question every morning: which tundish is closest to its repair trigger?
Fleet condition
One card per tundish shows its lowest zone, its residual in millimetres and its lives, with those near the trigger flagged.
Repair queue
Every tundish within 10 mm of the trigger, with the action agreed in TundRA.
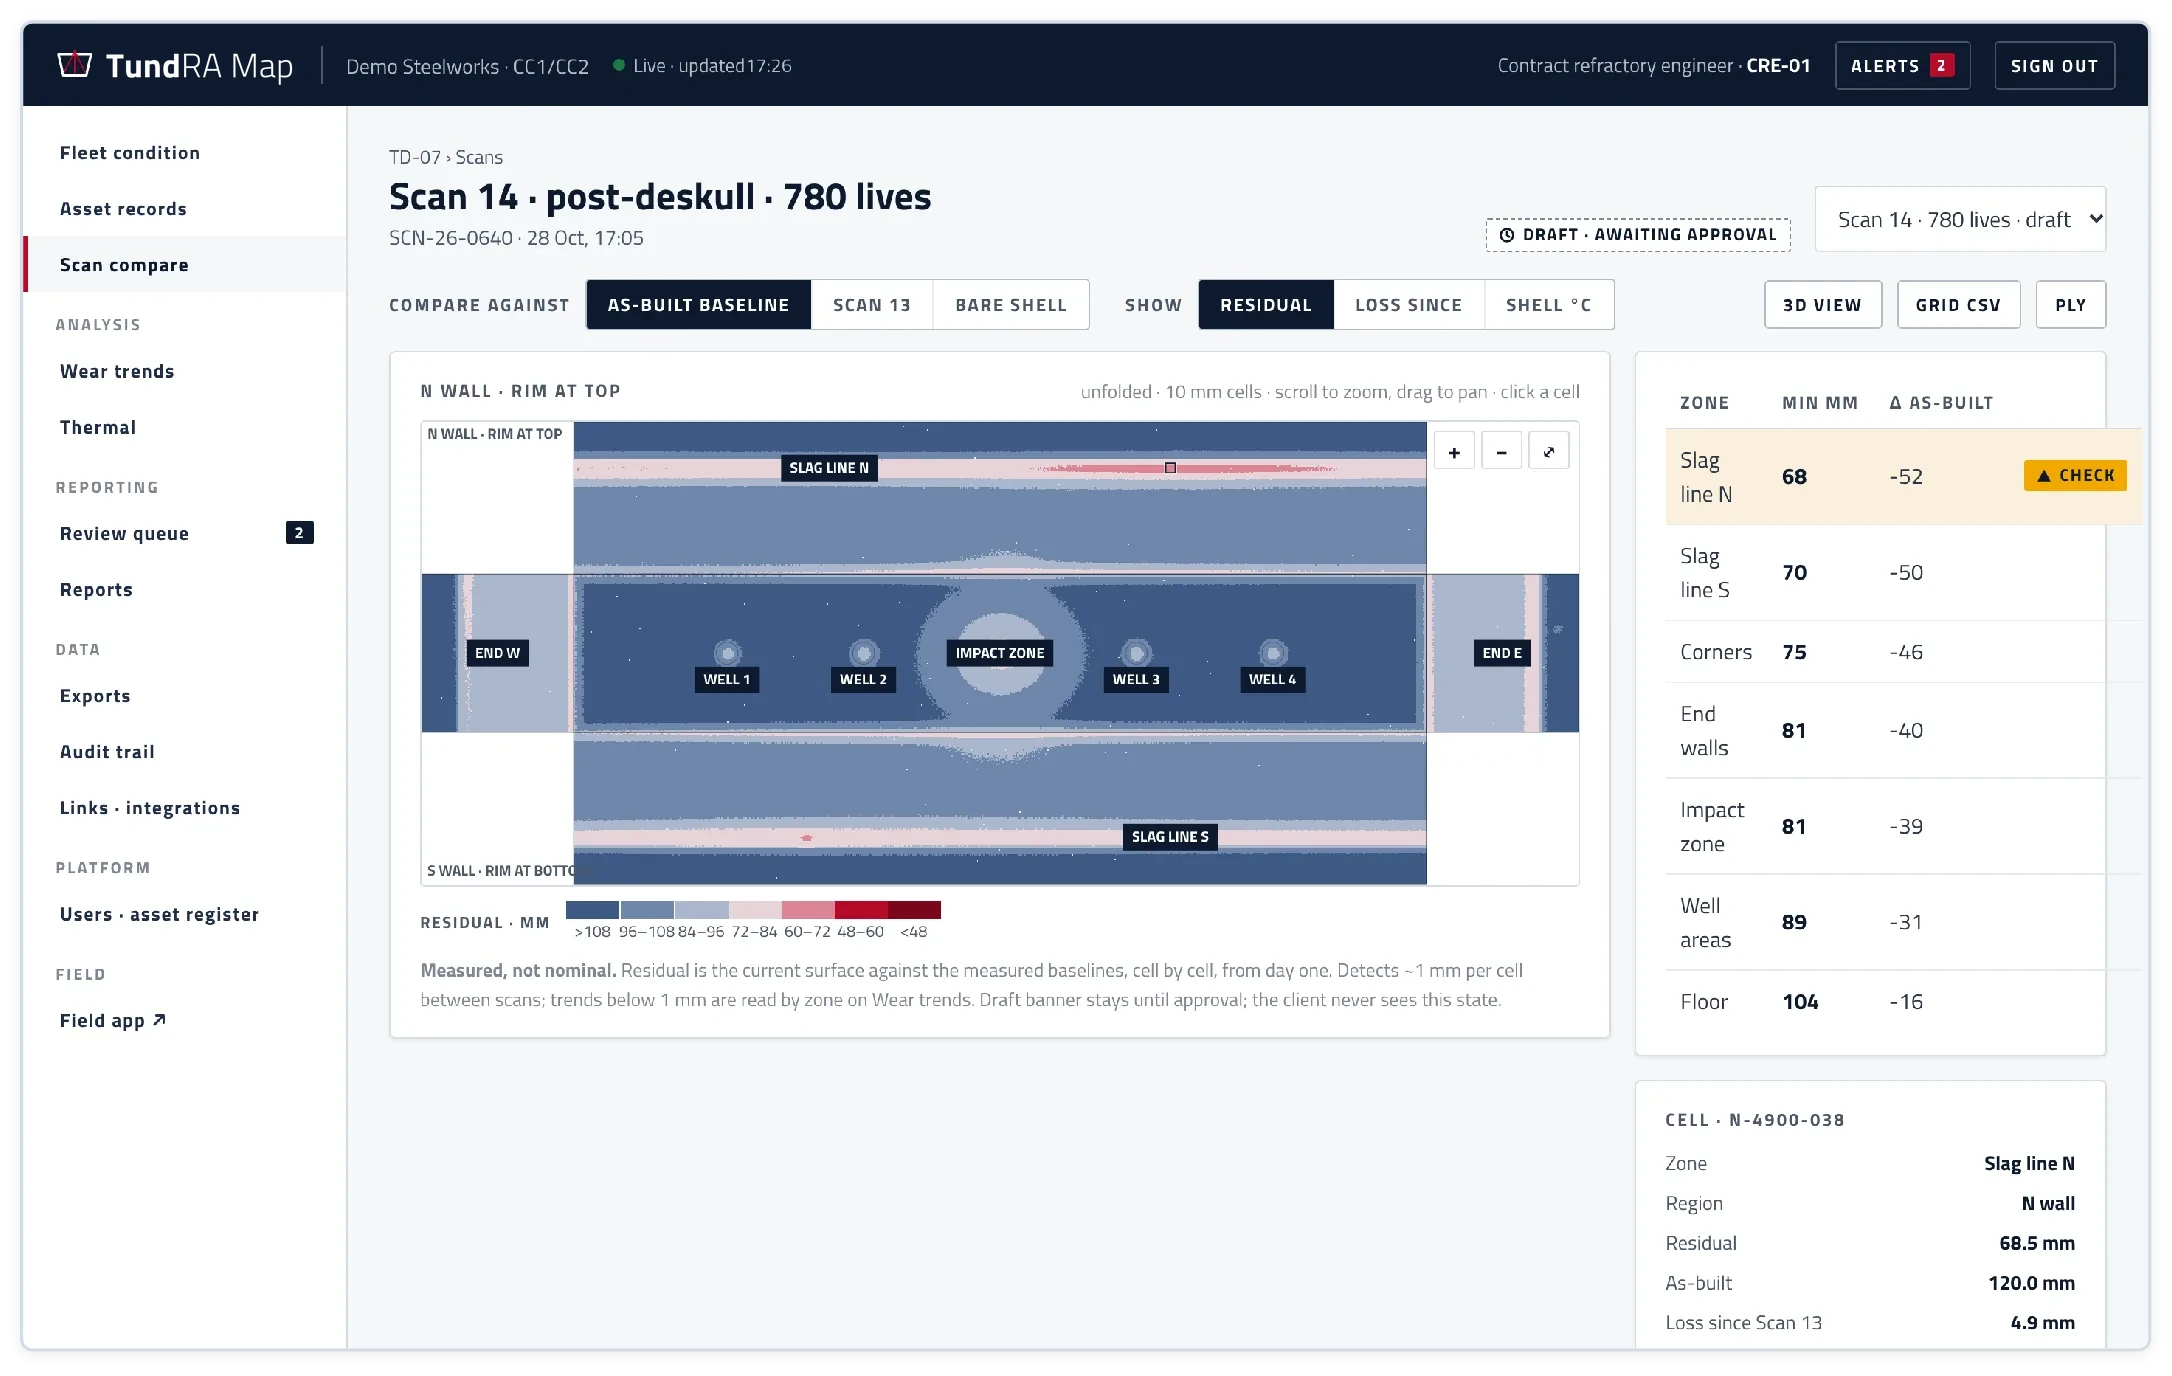
Scan compare
The whole lining unfolded into 10 mm cells, against the as-built baseline, the previous scan or the bare shell.
Click any cell
See its residual, its as-built thickness, the loss since the last scan and the points behind the value.
In 3D
Rotate the registered surface to see exactly where the lining is thinning.
Scan compare.
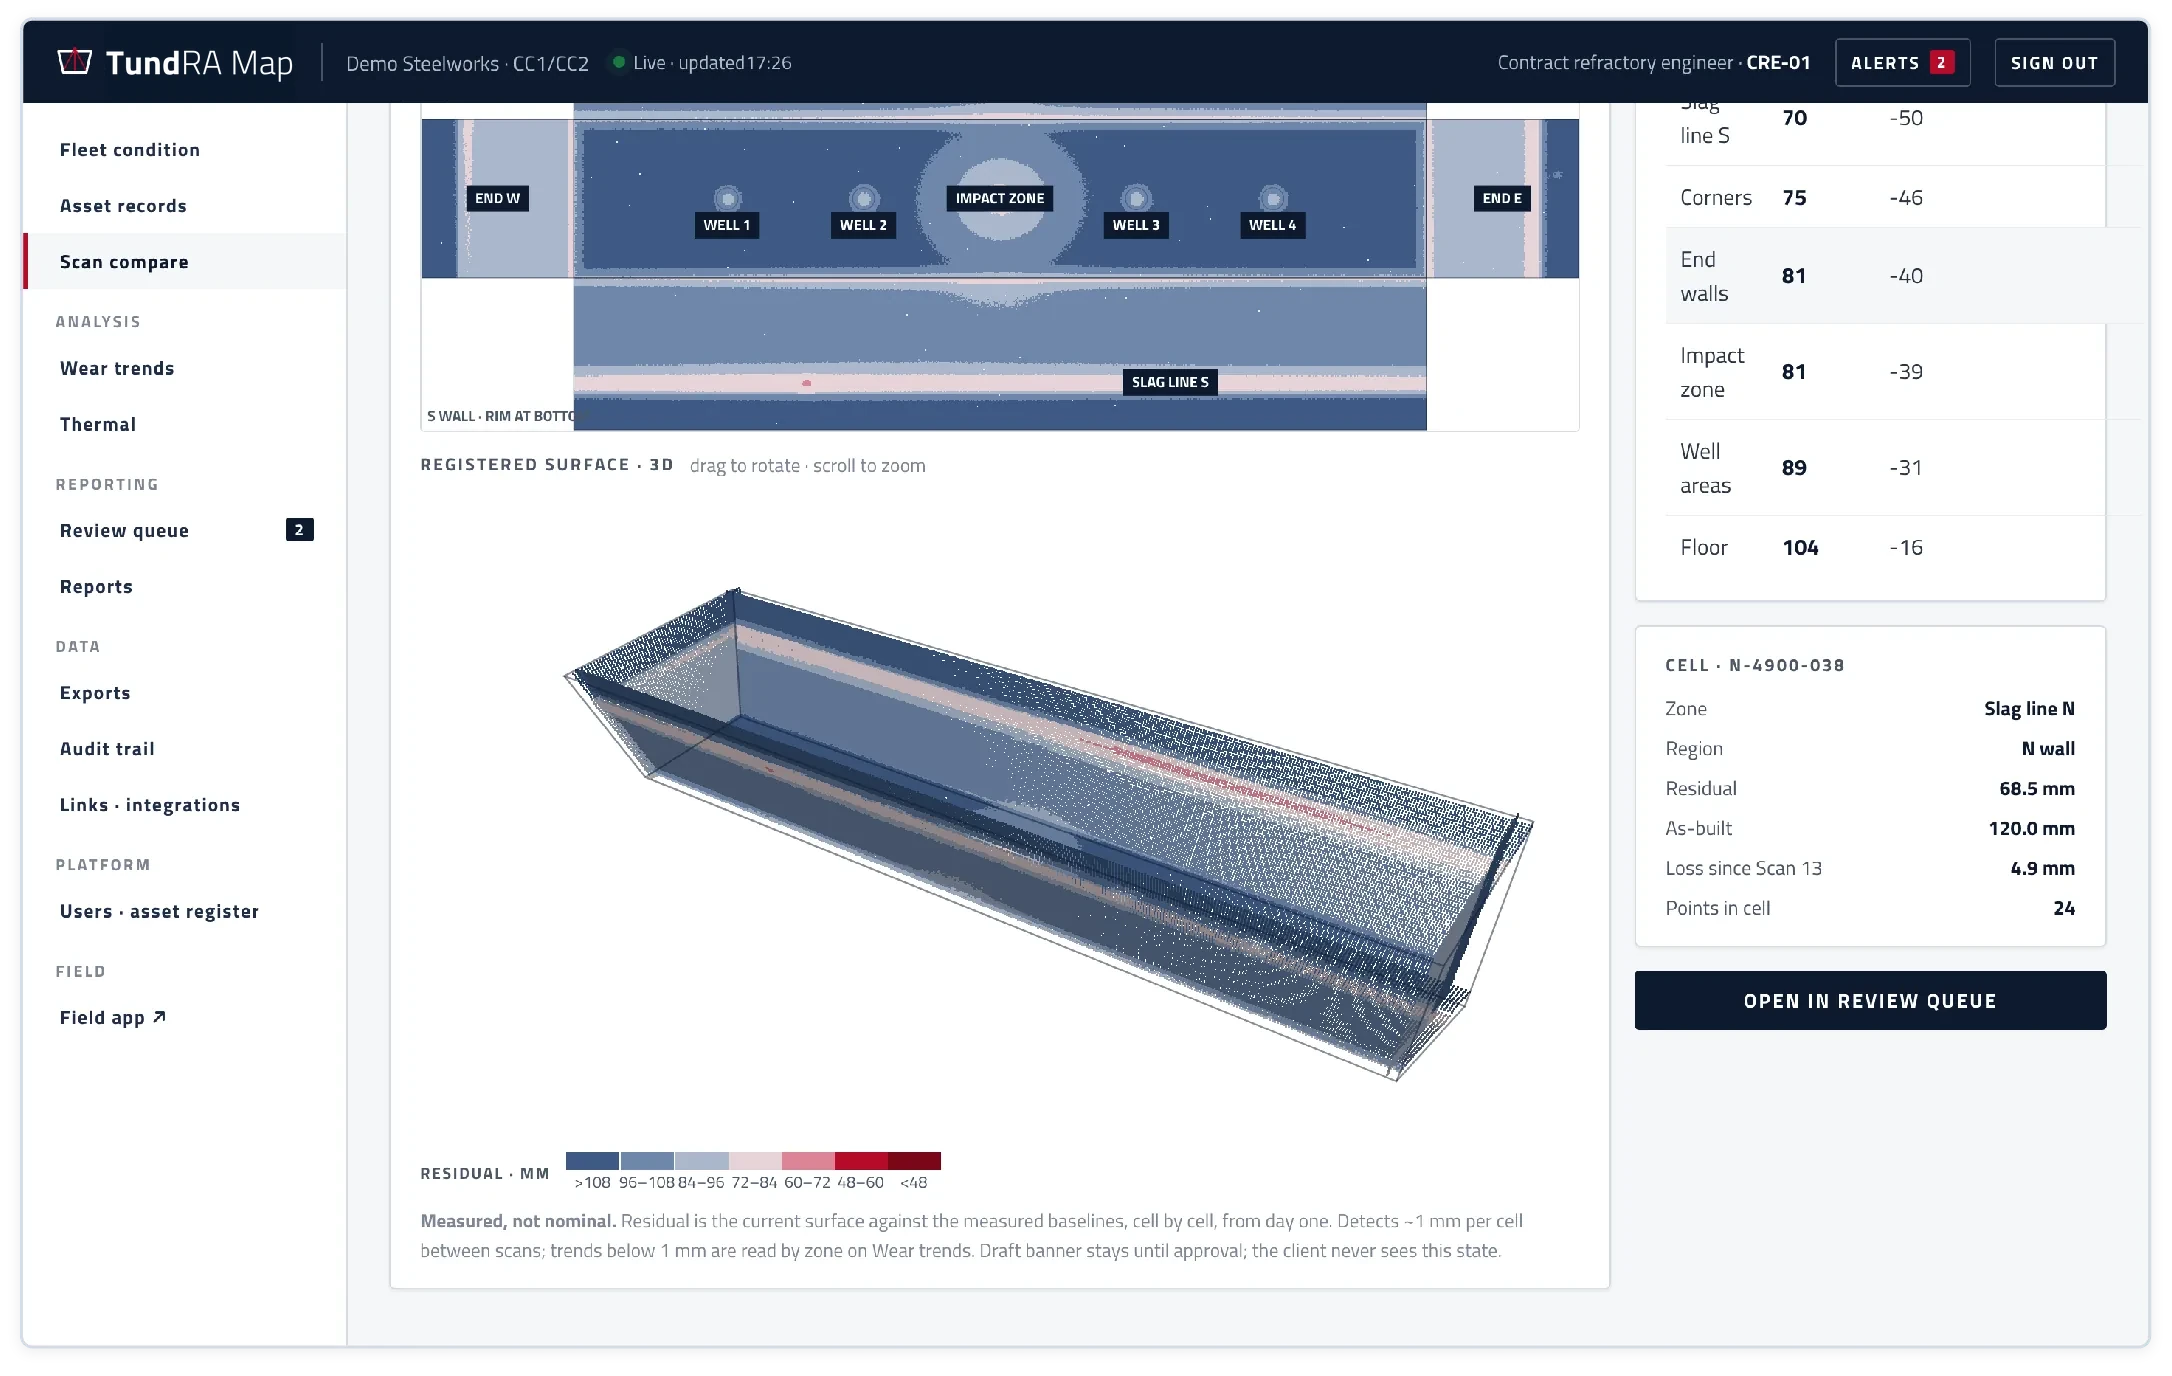
The registered lining in 3D, coloured by residual thickness.
The platform drafts. An engineer decides.
Every scan is reviewed by your own refractory engineer before it is released. Technical judgement stays with a competent person.
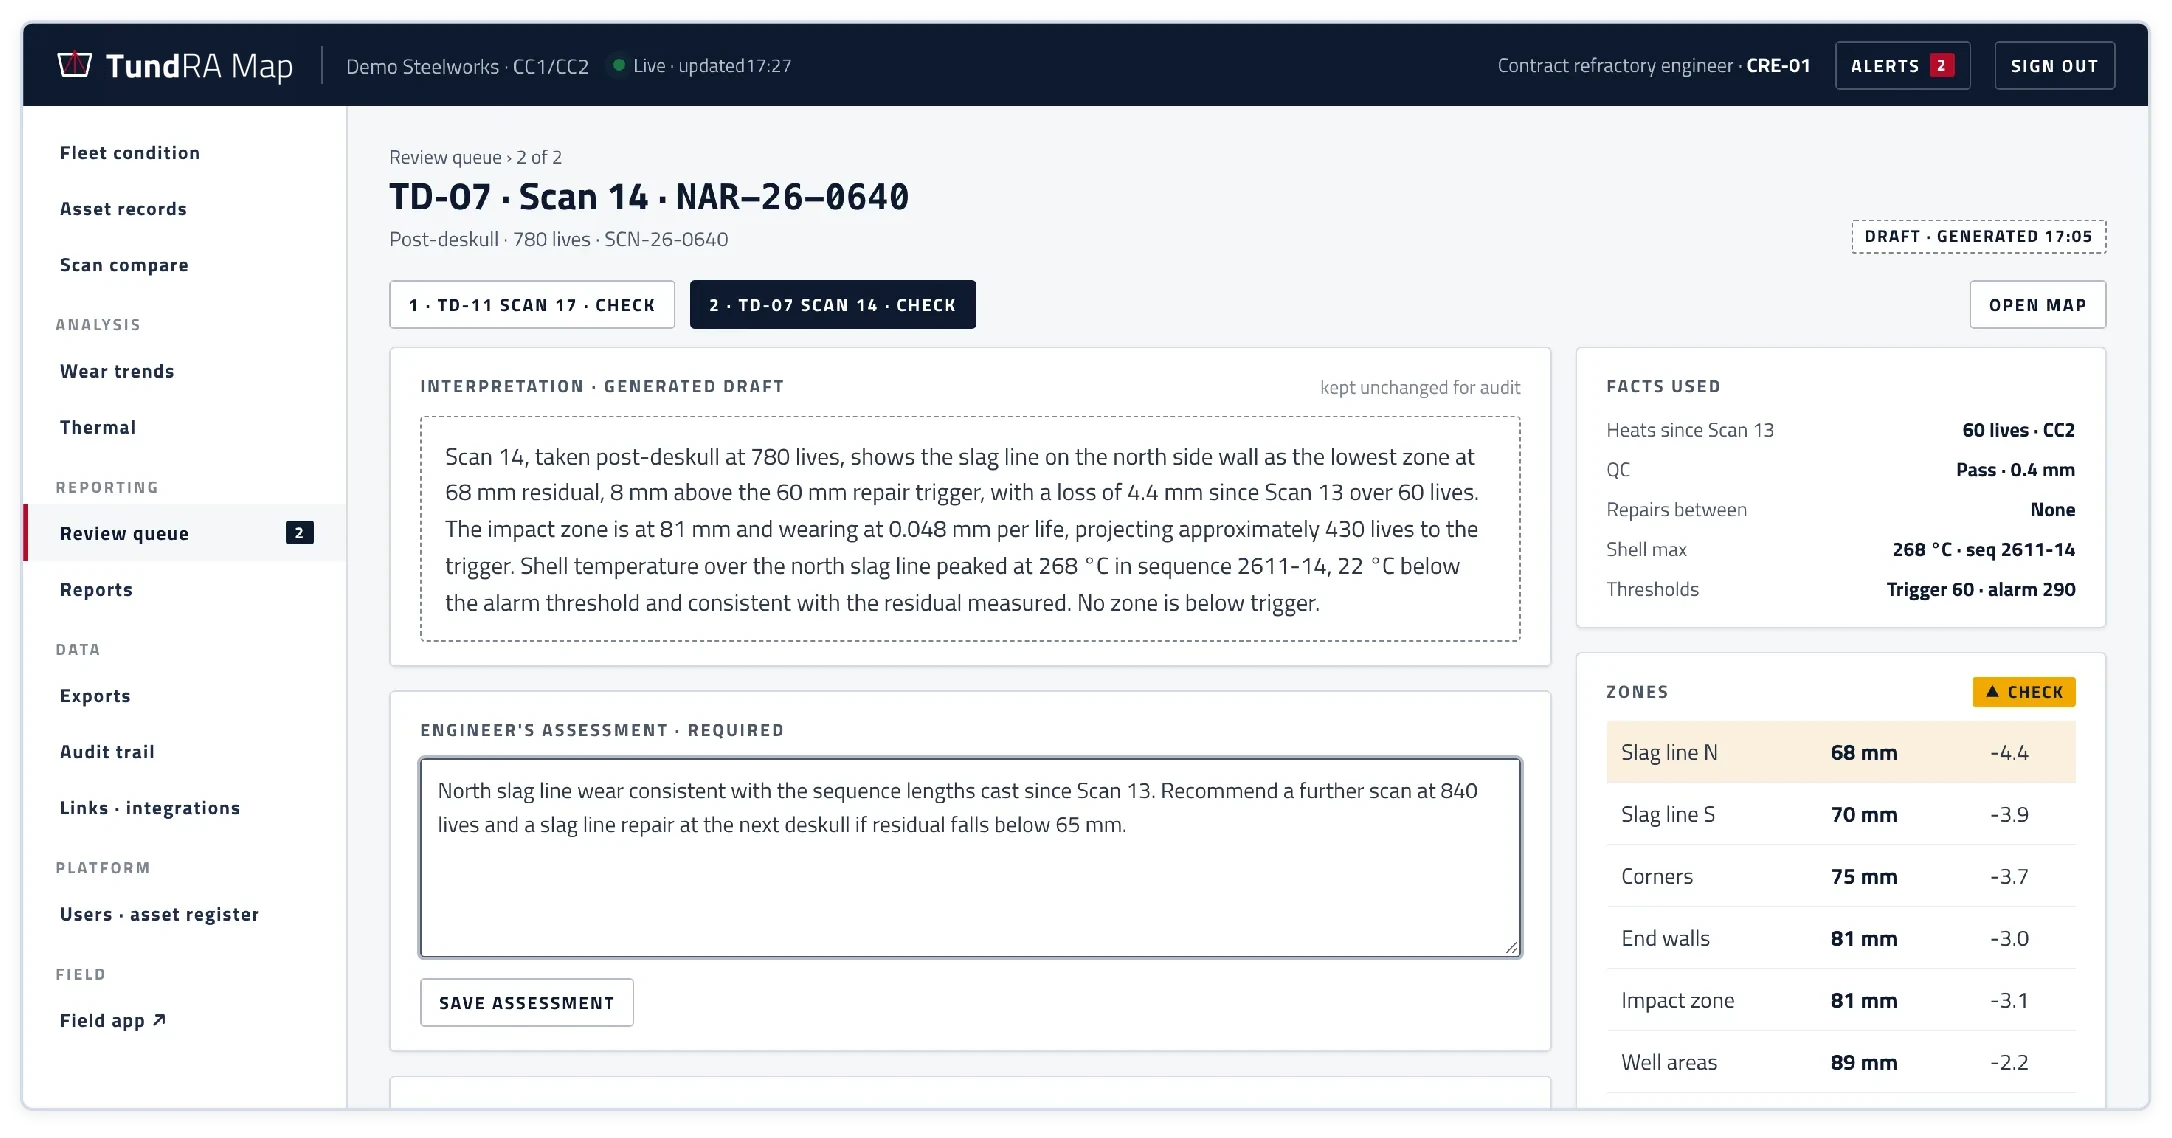
A written interpretation for every scan
What changed, where, how fast, and against which threshold, drafted from the scan and the tundish's history.
The engineer's assessment
Root cause and recommendation, required before approval. One action signs, timestamps and releases.
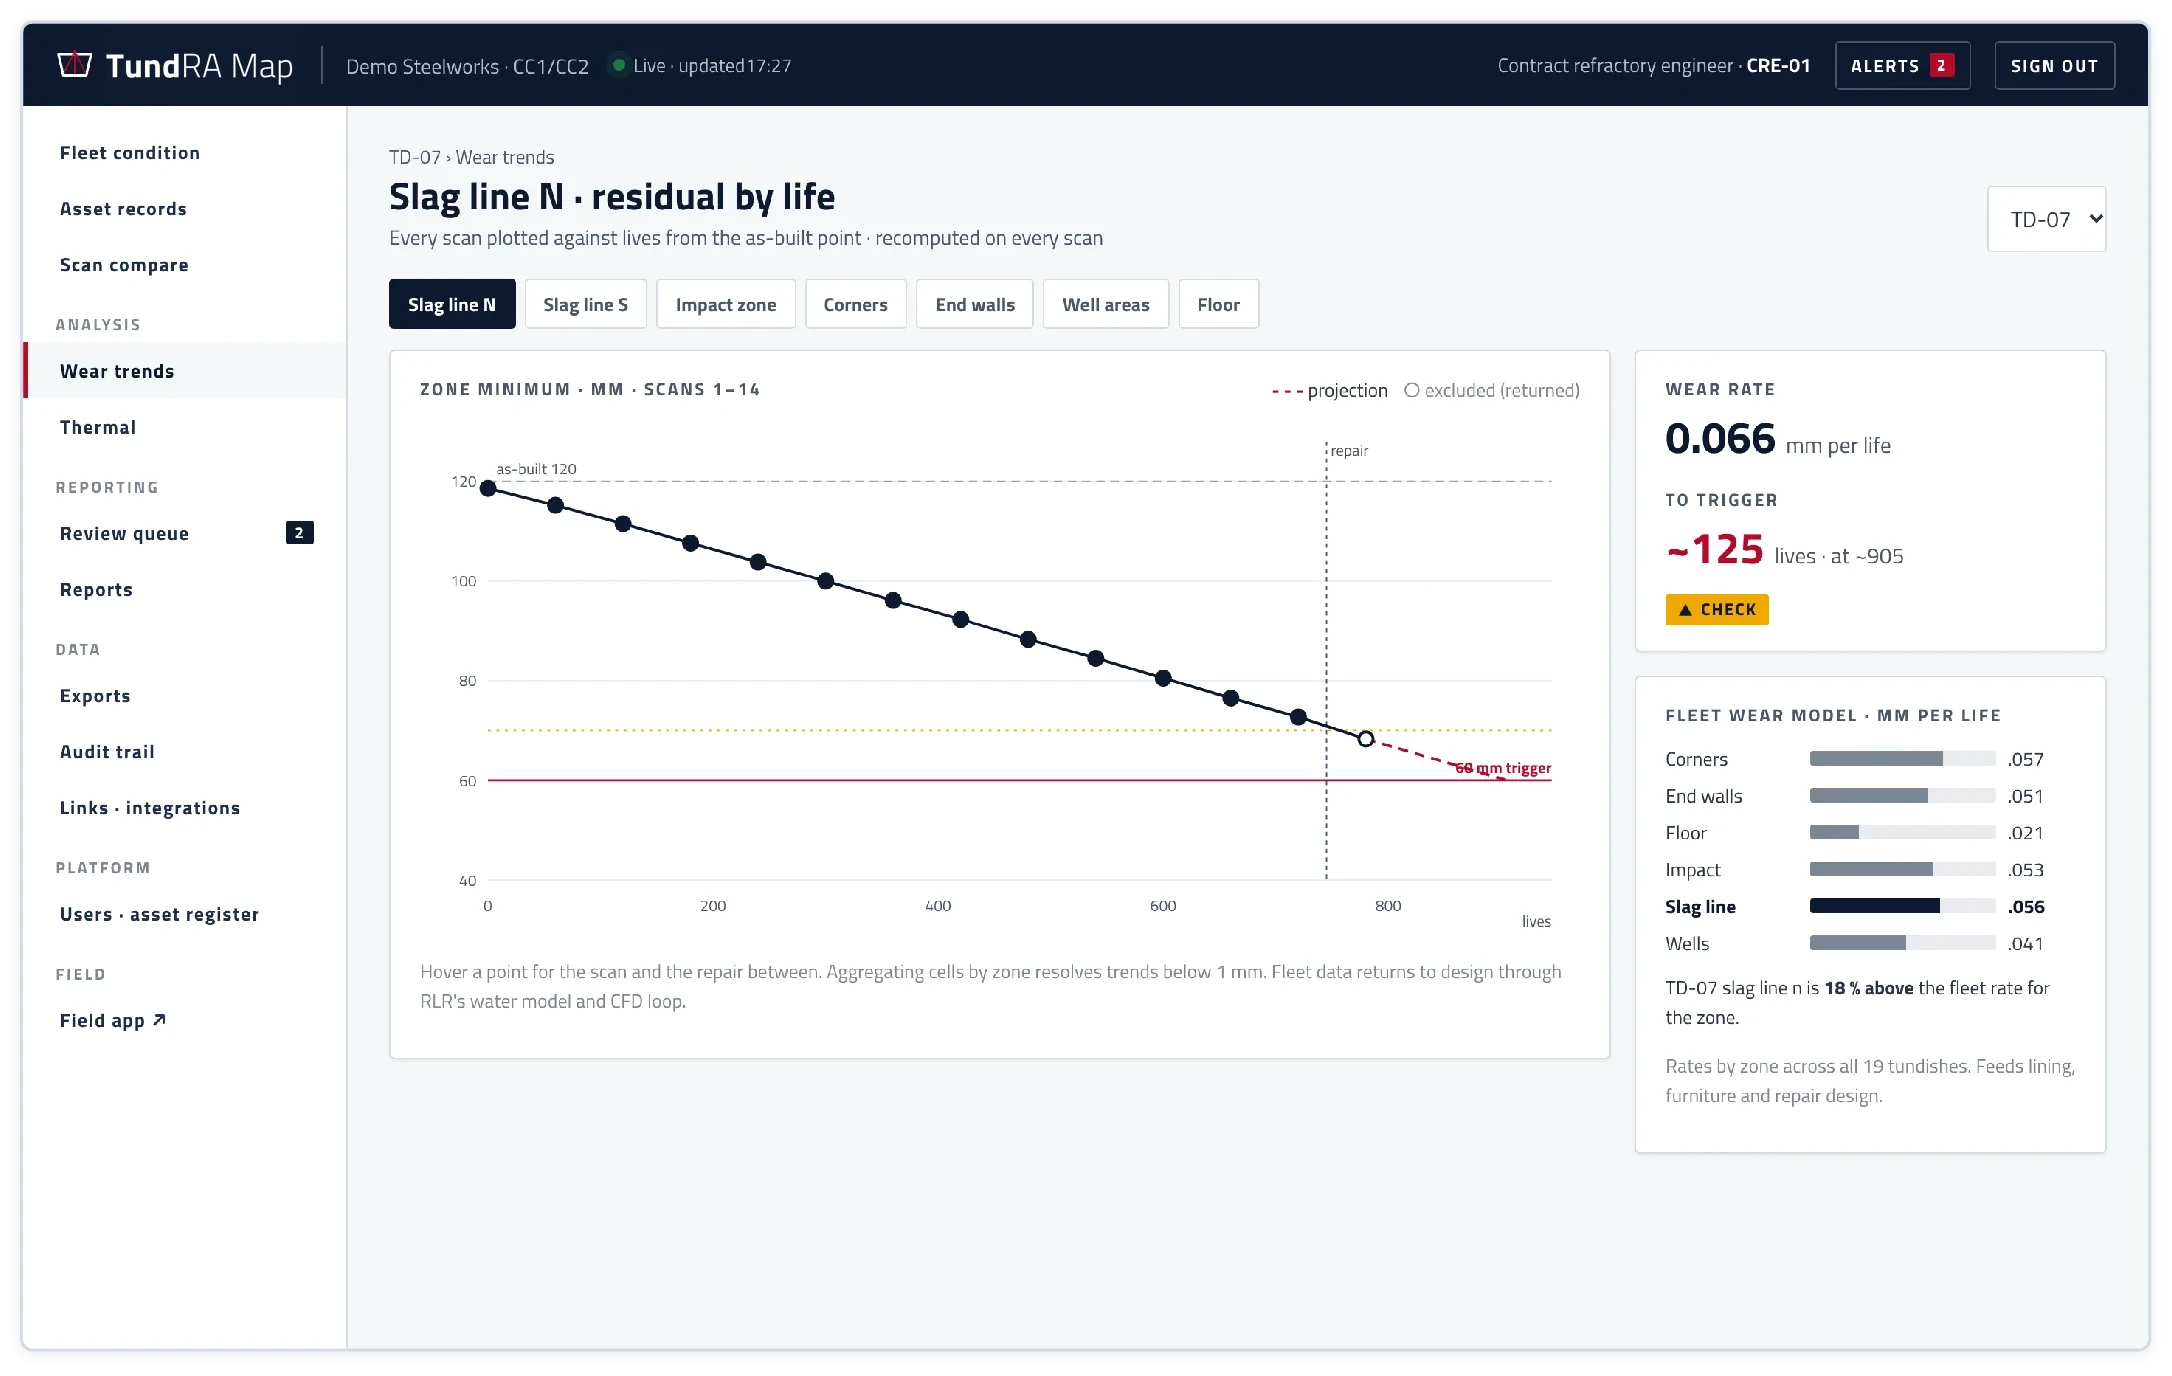
Wear trends
Every scan plotted against lives, with the wear rate per zone and a projection to the repair trigger. Repairs are planned from lives to trigger.
A fleet wear model
Wear rates by zone across every tundish, feeding back into lining, furniture and repair design.
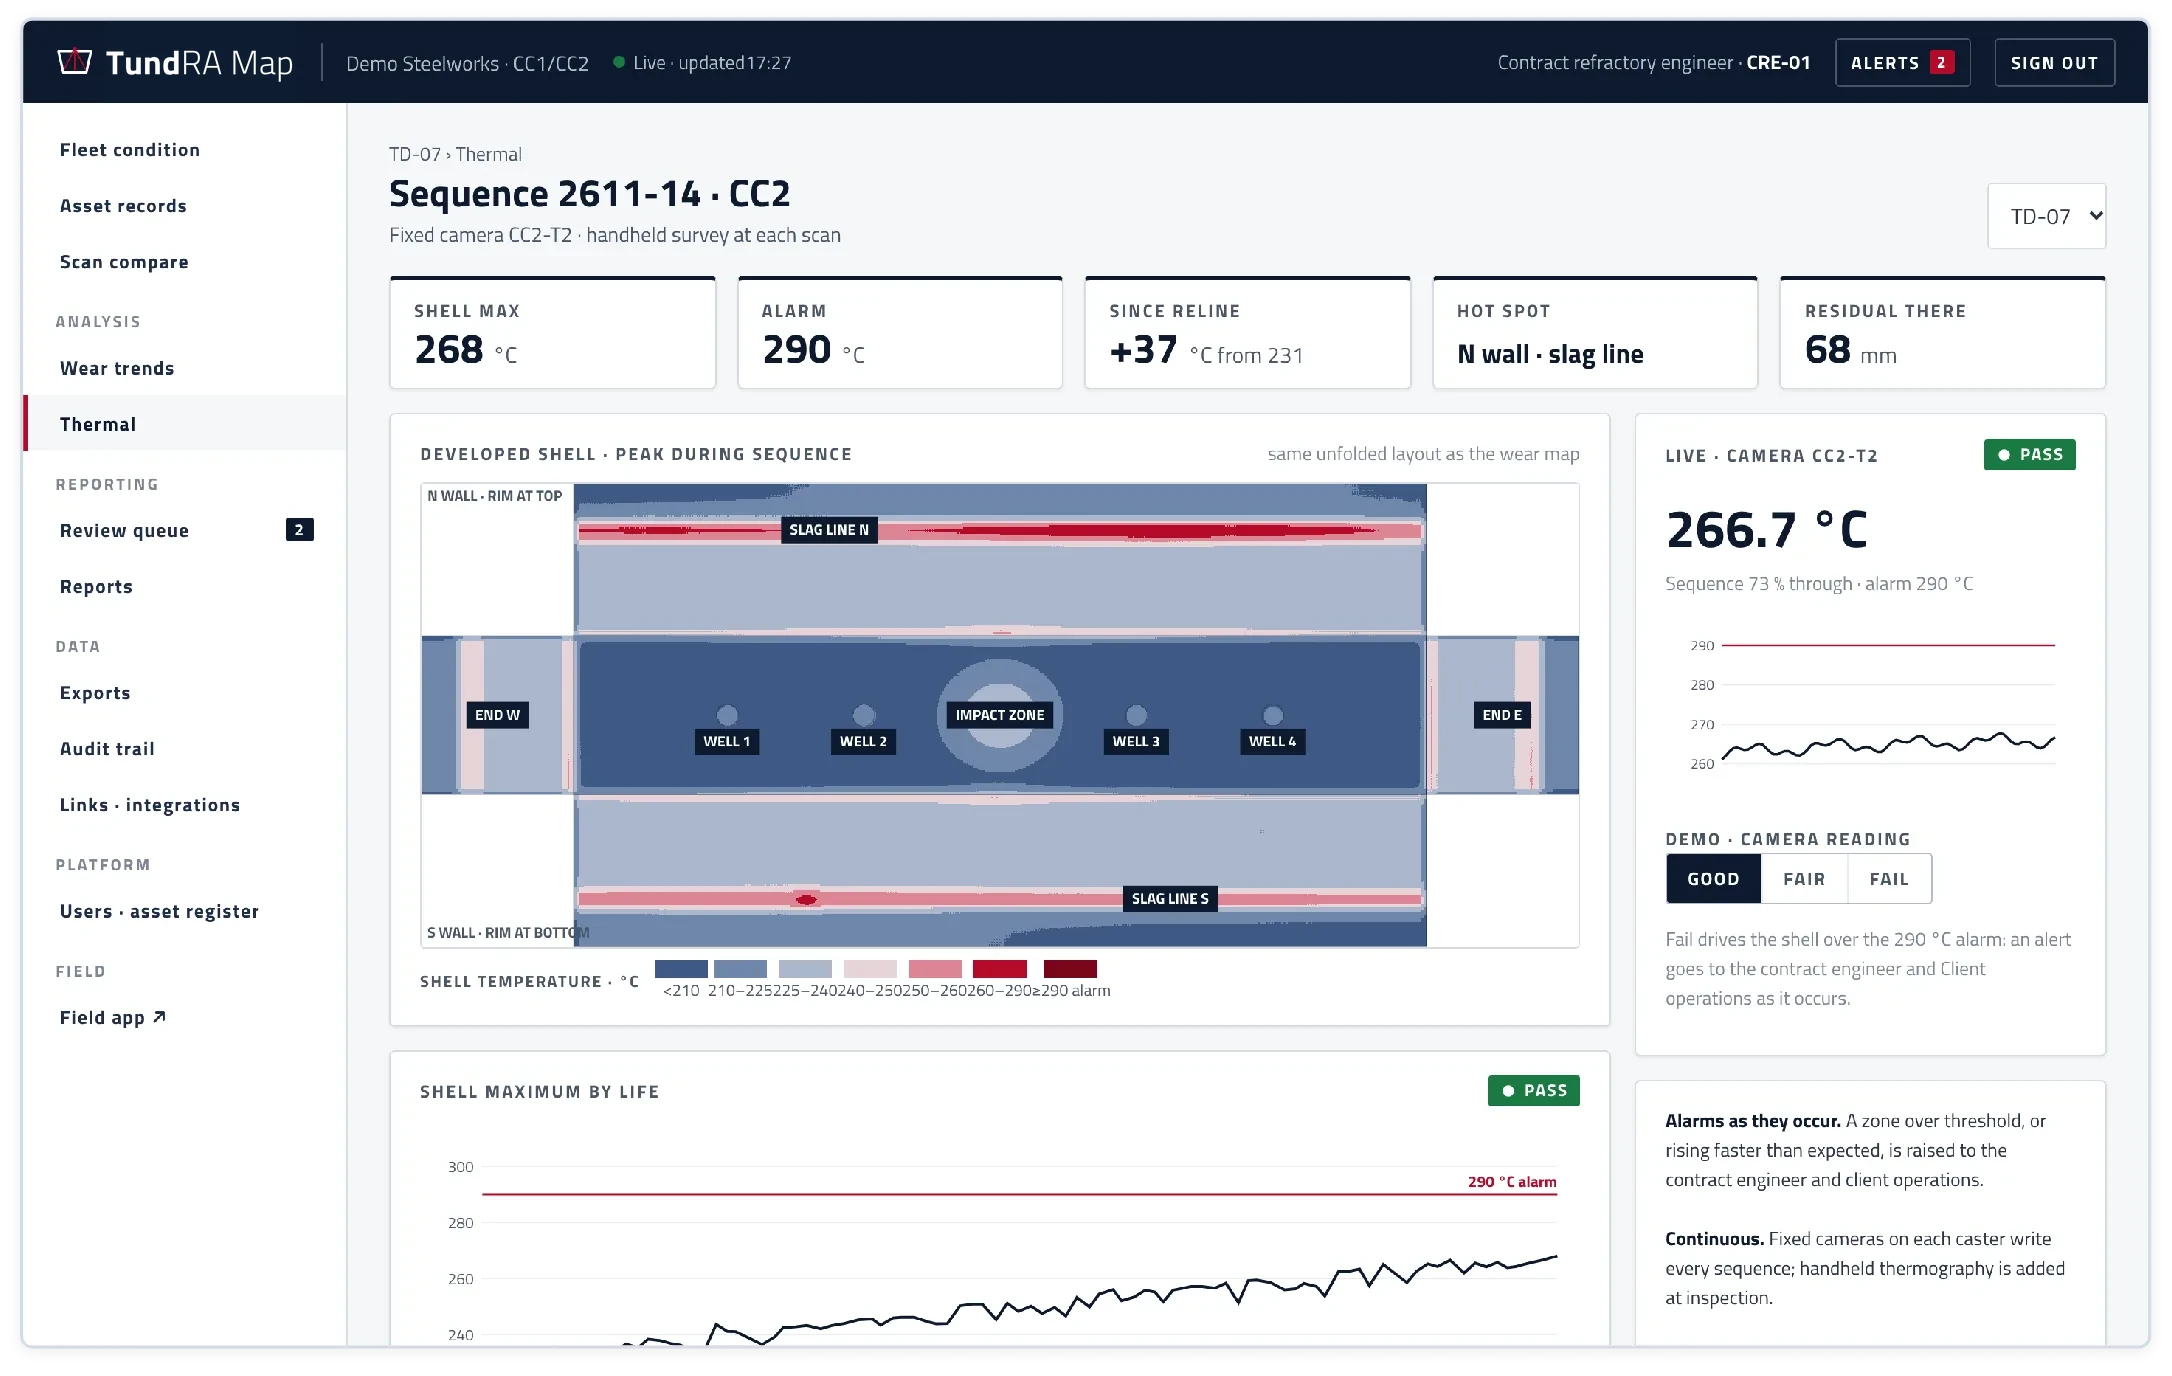
Thermal and wear together
The shell temperature map uses the same layout as the wear map, so a hot spot and a thin zone line up.
Exceptions as they happen
A zone within 10 mm of the trigger, or a shell over its alarm, is raised to the engineer and to the client's operations team straight away, not at the next report.
Your data. Your plant. Your record.
TundRA Map runs on your own sealed platform, and every record it holds is yours to export.
Controlled access for your team
Operations and the contract owner see fleet condition, released wear maps and every report, with downloads and exports.
One record per tundish
Installations, repairs, LIMS batch references, handover sheets and drawings sit on the same asset record as the scans, shared with the TundRA bay system.
Open formats
Reports as PDF, data as CSV, the registered surface as a PLY point cloud, and scheduled feeds to plant and maintenance systems.
A full audit trail
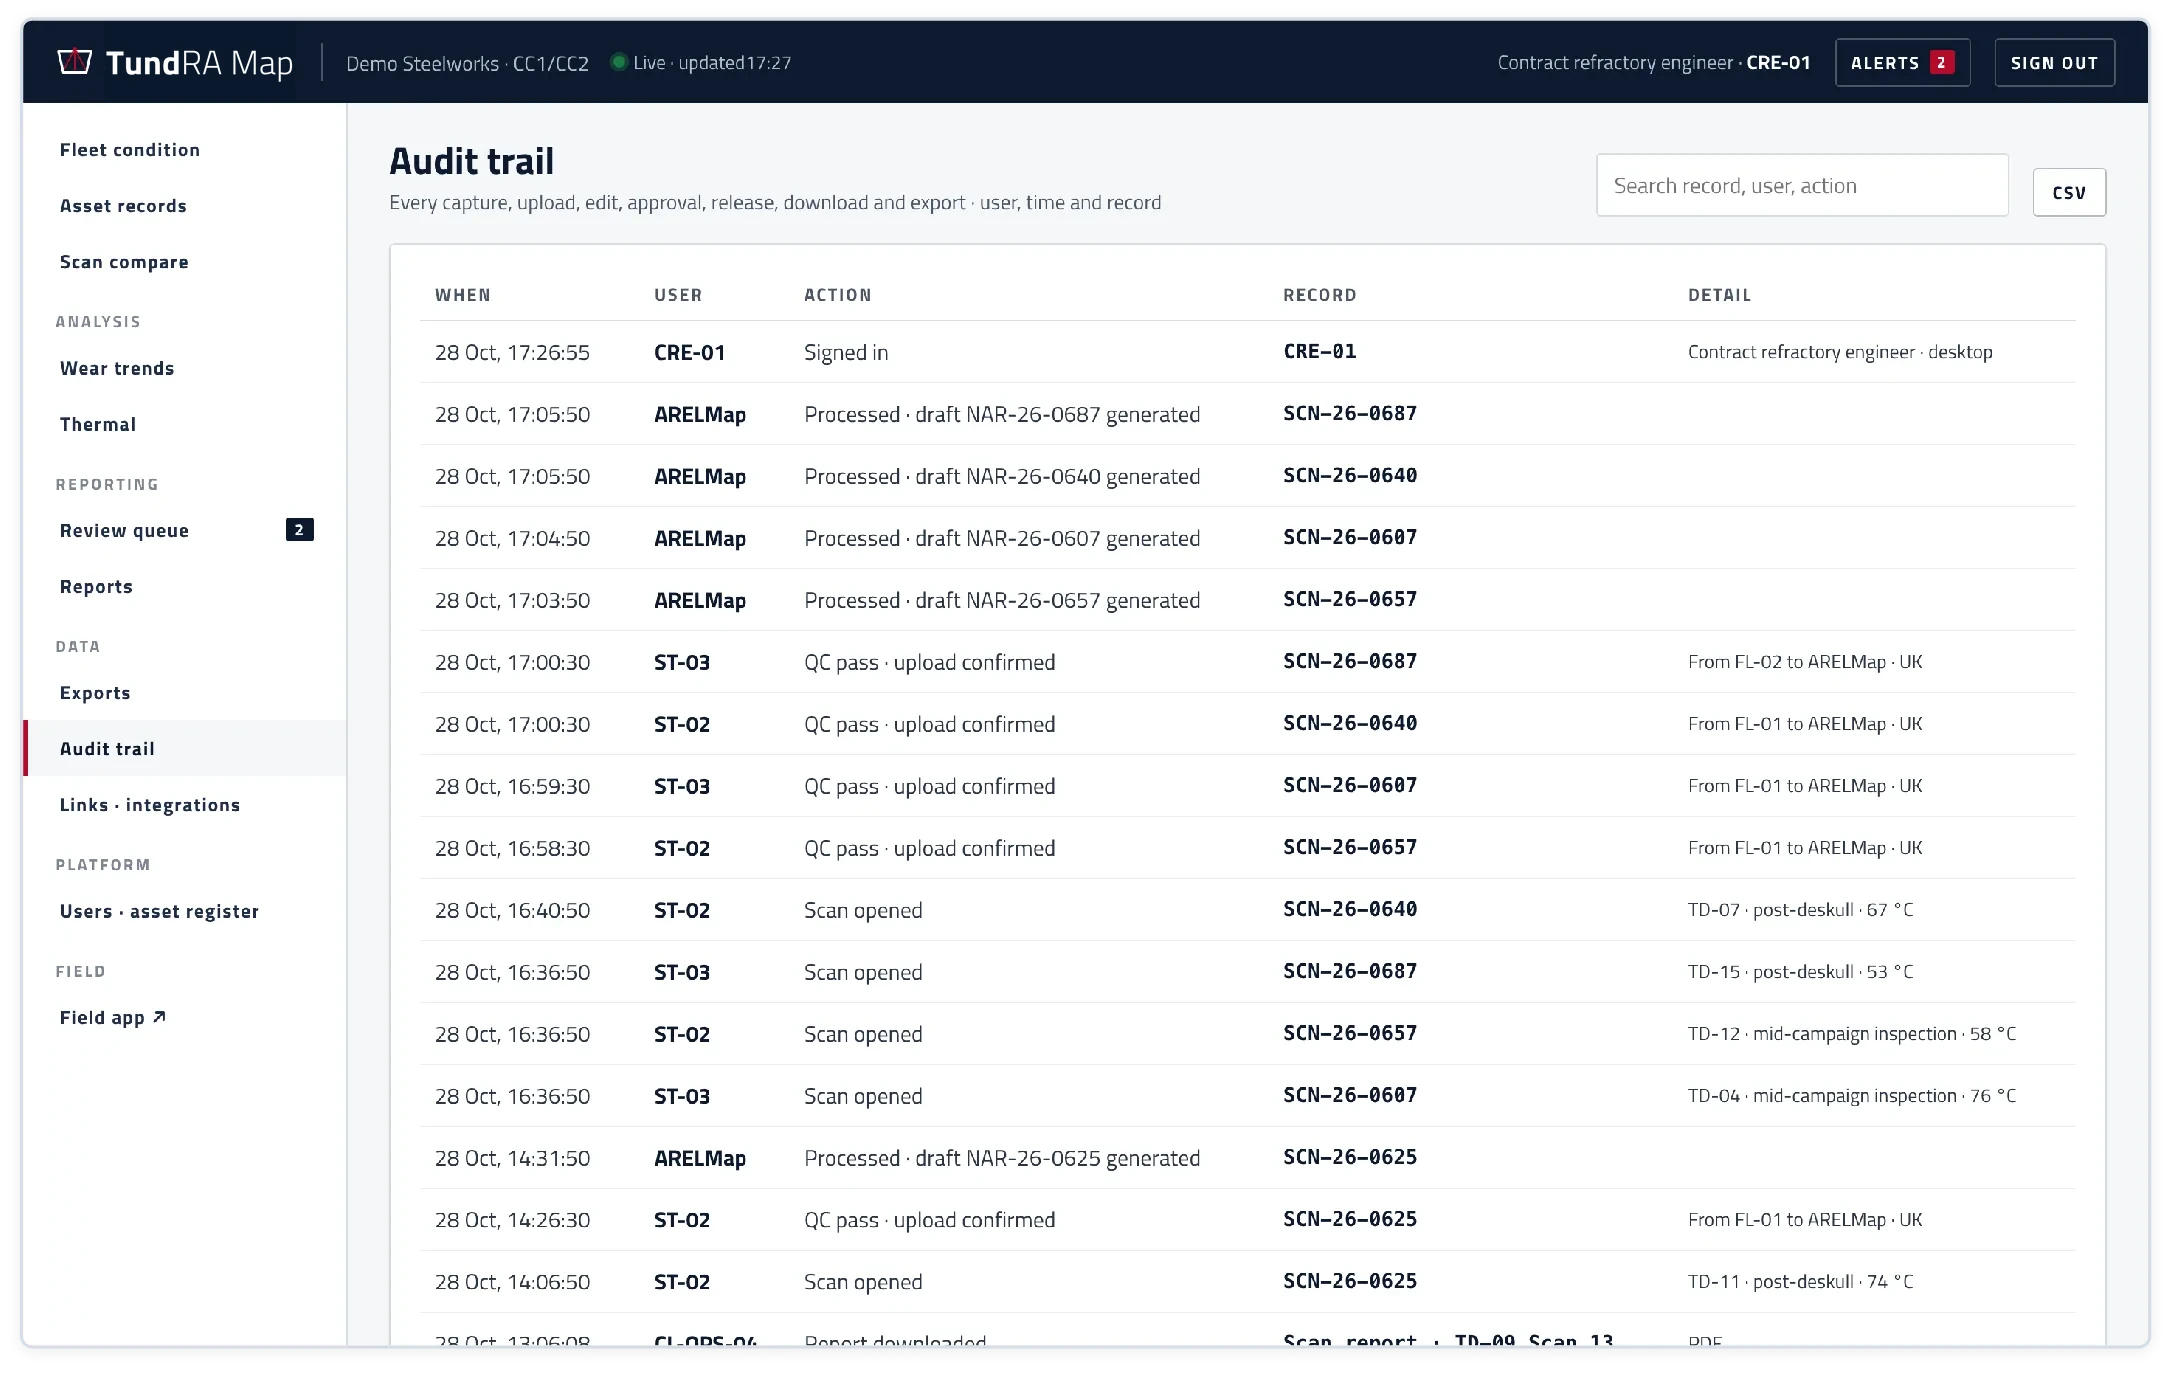
Every capture, upload, edit, approval, release, download and export, with the user and the time. Nothing is ever deleted.
Sealed for each client
Your own copy of the platform, with its own users, data and address. Processing and storage are UK-hosted; nothing runs on your systems.
Independent
No dependence on any third-party refractory supplier's software.
TundRA Map at a glance
Steelworks operations, maintenance and refractory managers running continuous-casting tundish fleets.
- 01Laser-scanned residual thickness, cell by cell, against measured baselines
- 02From scanner to engineer-approved report in about 30 minutes (design target)
- 03The whole fleet live, with exceptions raised as they happen
- 04Every result reviewed and signed by your refractory engineer
- 05One record per tundish, shared with TundRA
- 06Your data, in open formats, fully audited, sealed for your site